ChartDirector 控件使用方便、快速、靈活、功能強大、交互性強。在web以及嵌入式應用程序開發中,它是一種非常理想的工具,擁有豐富的圖表圖形組件庫,開發平台支持廣泛,支持ASP/COM/VB/VC;.NET2003/2005;PHP;JSP/JAVA;同時還支持Linux平台
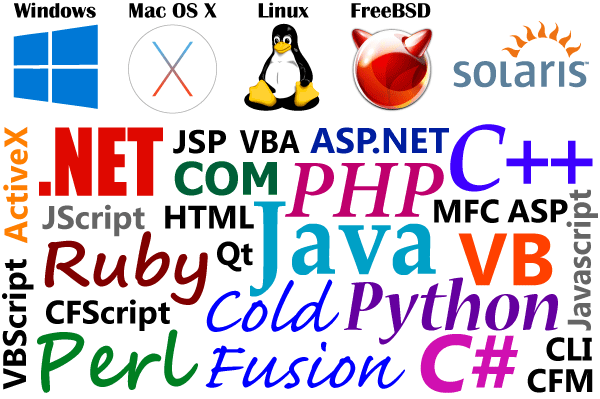
可建立PNG、JPEG、BMP、WBMP和GIF圖表,可以在所有的瀏覽器顯示,包括行動和手持設備。ChartDirector是Windows和Web應用程式的專業圖表組件。ChartDirector生產出的圖表文件體積小巧,一個200×200像素圖表檔案大小只有500-2000b。此外,產出的圖表可以插入電子郵件、word、PDF中。無客戶端Java或ActiveX控件支持AJAX的Web應用程式,所以可以不用重新傳送頁面下更新圖表。多平台:ChartDirector API可用在ASP/ COM / VB、NET、JAVA、PHP、PERL、PYTHON和C++。ChartDirector的ASP/ COM / VB和NET是在Windows上運行。ChartDirector的PHP、PERL、Python、Ruby和C++可在Windows、Linux(i386,x86_64)、FreeBSD(I386)或Solaris(Sparc)上運行。Perl5.6.0或以上可在Mac OS X(PowerPC、Intel)上運行。
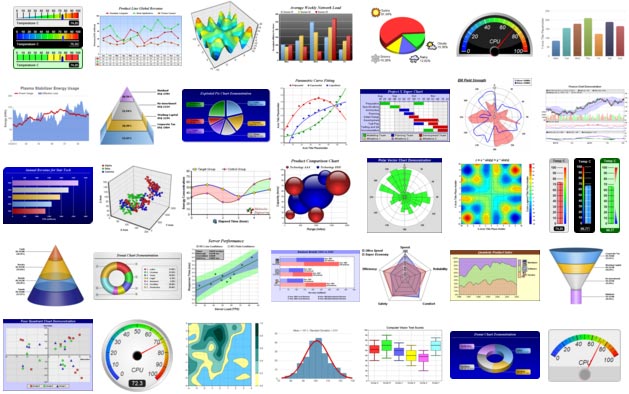
廣泛的圖表類型
Pie, donut, bar, line, spline, step line, regression, curve-fitting, inter-line filling, area, band, scatter, bubble, floating box, box-whisker, waterfall, contour, heat map, surface, vector, finance, gantt, radar, polar, rose, pyramid, cone, funnel ... even includes meters and gauges.
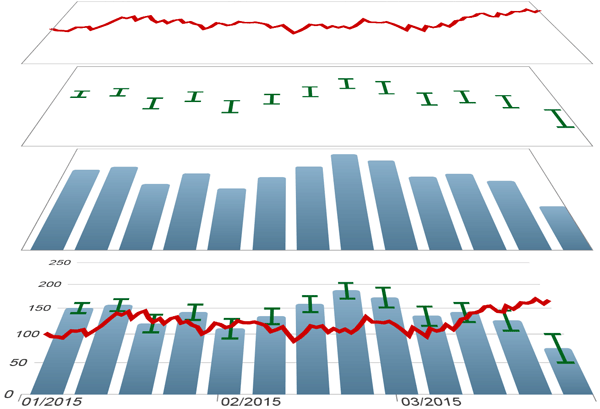
分層架構
Multiple chart types can be combined using layers to create customized combo charts. You can also use layers to add symbols to highlight specific points, add markers, thresholds, zones, error bands ... The possibilities are endless.
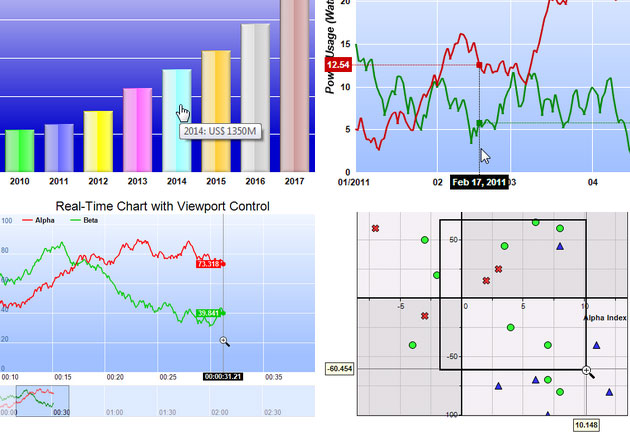
即時,互動,大數據圖表
Real time charts with programmable track cursors and tooltips. Plot charts with millions of data points. Viewport with zooming and panning facilitates visualization of large data sets. Custom mouse and touch event handlers for chart objects.
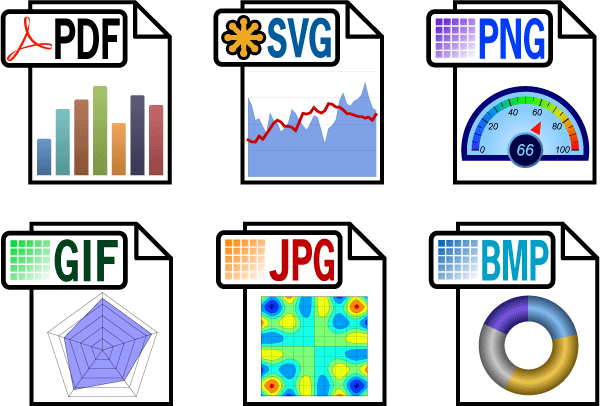
PDF, SVG and Images
Apart from displaying on screen, charts be created as PDF and SVG, as well as PNG, JPG, GIF and BMP images. This means you send the charts by email, insert them into reports, or save them as records.
普遍
ChartDirector is suitable for various application types (desktop, web, console, batch, realtime ...) and supports many programming languages and operating systems. This means your investment in ChartDirector will be useful for your current as well as future projects.
更新介紹
New Features
Treemap Chart
TreeMap chart is a new chart type in ChartDirector. A treemap chart is similar to a pie chart. Whereas a pie chart divides a circle into slices, a treemap chart divides a rectangle into multiple rectangles. The child rectangles can be divided into yet more rectangles. So a treemap chart can be used to visualize a tree like data structure with multiple levels of divisions.
Discrete Heat Map
Discrete Heat Map is a new layer type for XYChart. It consists of square or rectangular cells colored based on their data values. Like a contour layer, a discrete heat map layer contains a color axis that maps data values to colors.
Circular Bar Meter
A circular bar meter is like a linear bar meter, but with the bar bends in a circular direction. By using an angular gradient, the colors along the bar can vary depending on the meter value. The center of the meter can be used to display the meter value in text.
Multi-Page PDF Output
The PDF output feature of ChartDirector has been extended to allow generating a PDF with multiple pages. Each page can contain multiple charts as well as free form text, tables, drawings and images. That means ChartDirector can now generate complete PDF reports.
Huge Data Set Support
With the new DataAccelerator object, ChartDirector can plot charts with a billion data points, with smooth zoom, scroll and track cursor support, and updating at thousands of data points per second in real time.
High DPI Support
ChartDirector GUI controls, such as the chart viewer controls and viewport controls in C++ and .NET, will now automatically detect if the application is high DPI aware, and will resize render the charts at the detected DPI. There are also APIs to force the charts to render at a given DPI.
CDML Tooltip
ChartDirector GUI controls now support tooltips formatting with CDML (ChartDirector Mark Up Language). This allows rich formatting of the tooltips, semi-transparent tooltip container, and allows the tooltips to contain icons and images.
CDML Enhancements
CDML adds support for containers with rounded corners and configurable margins, and polyshape symbols. (See PolyShape section below.)
Contour Labels
ChartDirector can now draw labels along the contours in a contour chart or heat map. This allows contour values to be displayed directly on the contours, instead of having to lookup their values based on the underlying colors.
Contour Cross Section
ChartDirector can now computes the cross section between two points on a contour chart or heat map. The cross section is represented as the z values along a straight connecting the two points.
Contour Tooltip
ChartDirector now supports continuously varying tooltips on a contour chart or heat map to display the (x, y, z) values as the mouse moves.
Contour getZAtPixel
ChartDirector 7.0 introduces a new API ContourLayer.getZAtPixel for obtaining the z value at any (x, y) position on a contour chart or heat map.
4D Surface
In a surface chart, the surface is defined with (x, y, z) coordinates. By default, the z coordinate also determines the surface color. ChartDirector now supports using an extra coordinate w for the surface color. For example, the w coordinate can represent the temperature on the surface. In this case, the color will be based on the temperature instead of the z coordinate.
Surface XY Projection
The projection of a surface chart on the XY plane is a contour chart. ChartDirector can now include the projection on the XY wall of the surface chart.
Surface Lines and Zones
ChartDirector now supports including custom line segments and rectangular zones on the surface or a surface chart.
Surface Texture
ChartDirector now supports drawing a custom image on the surface of a surface chart, The image can be semi-transparent so as not to block the underlying surface. The image can be generated on the fly by using another chart or the DrawArea object. This feature is useful for adding custom annotations on the chart. An example is to use a polar chart as the image to include semi-transparent circular zones on the chart.
Surface Tooltip
ChartDirector now supports continuously varying tooltips on a surface chart to display the (x, y, z, w) values as the mouse moves.
Surface getValuesAtPixel
ChartDirector 7.0 introduces a new API SurfaceChart.getValuesAtPixel for obtaining the (x, y, z, w) values any pixel position on a surfaced chart.
Surface Chart output in PDF/SVG
The PDF and SVG formats are basically designed for 2D graphics. In previous versions of ChartDirector, for 3D surface charts, ChartDirector needs to use varous ways to emulate 3D graphics with the 2D graphics capability of SVG/PDF. The resulting SVG/PDF can become very large and complex that many SVG/PDF viewers and browsers have difficulty displaying them.
ChartDirector 7.0 now uses hybrid rendering methods. The 3D parts are pre-rendered by ChartDirector while the text, lines and 2D parts of the chart are rendered using PDF/SVG graphics. The resulting PDF/SVG is much smaller and can be viewed by common PDF/SVG viewers and browsers.
Keep Aspect Ratio Zooming
In previous versions of ChartDirector, for zooming support, the x and y directions zoom independently. It is common to find charts that only zoom in the x direction. For charts that zoom in both directions, the user can drag a rectangle to zoom into such that the x and y directions zoom by different factors.
ChartDirector 7.0 introduces a "keep aspect ratio" mode to keep the aspect ratio unchanged during zooming. This is useful for contour charts related to geographic maps of which the x and y directions must zoom by the same factor.
Angular Gradient Color
ChartDirector now supports angular gradient color, which is a gradient which changes color depending on the bearing of the pixel relative to a center point.
X-Scale Color and Y-Scale Color
In previous versions of ChartDirector, color scales are used to define the colors based on the z values for contour and surface charts. ChartDirector 7.0 now extends this to support coloring objects based on the x and y values in XY charts.
ColorAxis.getColorScale
ChartDirector can now export the color scale of a color axis. The color scale can be used in other charts to ensure they have consistent colors. For example, if a cross section of a contour chart is to be visualized as an area chart, the color scale of the contour chart can be used as the y-scale color of the area chart to ensure consistent colors.
Axis.syncScale
ChartDirector 7.0 introduces a new Axis.syncScale API to synchronize the axis scale only. In contrast, the existing Axis.syncAxis API sychronizes both the axis scale and geometry.
Axis.syncAxis is designed to synchronize the y-axes or x-axes of the an XY chart, To ensure the scales are perfectly aligned, the axes are assumed to have the same length. If the source axis is configured with axis margins, the axis sychronized with it will automatically have the same margins.
Axis.syncAxis is not suitable for axes with different lengths, such as axes from different charts. Examples include sychronizing an axis of a large chart with an axis for a small thumbnail chart, or synchorinzing a color axis with a y-axis. For these cases, Axis.syncScale can be used instead.
XY Size for Symbols
In previous versions of ChartDirector, for a scatter symbol, the size parameter refers to both width and height. Symbols with different width and height requires two arrays to specify the widths and heights individually for each symbol.
ChartDirector 7.0 introdues a new API xySize that can encode different width and height into a single size parameter. For example, it is now possible to specify an ellipse symbol by using a "circle" symbol with different width and height.
Legend Box CDML Text Item
A legend item in ChartDirector's legend box typically contains an icon, followed by text that describes what the icon means. ChartDirector 7.0 adds support for a pure text item. The text can be CDML (ChartDirector Mark Up Language) formatted. It can be used to add headings or empty lines to separate the legend items into sections, or to add legend items with icons in non-standard positions.
PolyShape Support
ChartDirector allows using custom shapes for symbols. In previous versions of ChartDirector, a custom shape can be any polygon or ellipse. ChartDirector 7.0 adds support of compound shapes filled using the even-odd rule. For example, it is now possible to make a hexagon symbol with a transparent circular hole inside by combining a hexagon and a circle inside. The even-odd rule means the region inside the circle is not filled at all, so it becomes a transparent hole.
Font Specification
In previous versions of ChartDirector for C++, Perl, Python, PHP and ASP/COM/VB, fonts are specified using their file names. ChartDirector 7.0 also allows fonts installed in the Windows or macOS operating system to be specified with their family names, followed by optional "Bold" and/or "Italic" keywords. Font file names remain supported as they are useful for private fonts or fonts embedded as resources in the executable.
Open Type Font with Postscript Outlines (CFF Font) Support
In previous versions of ChartDirector for C++, Perl, Python, PHP and ASP/COM/VB, only true type fonts (including open type fonts with true type outlines) are supported. ChartDirector 7.0 adds support for open type fonts with postscript outlines too.
分層功能
讓您可以合成圖表使用標準圖層。使用圖層可組合圖表,可在圖表中添加特殊符號、標誌和標籤等物件,可標明圖表物件,可添加錯誤帶…等等。
多種圖表樣式
圓餅圖、環狀圖、條形圖、折線圖、步驟圖、趨勢圖、曲線圖、分隔線、區塊圖、線條、點圖、金融圖、甘特圖,箭頭、雷達…等等。
財務資料庫與原始碼
包含46個先進的金融圖表資料庫,並附帶原始碼。其可畫出任意角度及水平和垂直的圖形。
客製化功能
強大客戶導向的API,允許您自己定義每個圖表的詳細資訊。
靈活的方向軸系統
每個圖表 XY軸的數量不受限制。可以自動、半自動和手動縮放,無論是線性、對數、日期/時間和標籤軸。另外還可以配置軸邊距及自制軸標籤。
支援標明文本
創新的CDML技術允許多樣的文件格式-如在文件中嵌入的圖標和圖片,使用多種字體和顏色在同一個文本中,控制文件佈局、對齊、行距…等等。
先進的色彩系統
ChartDirector的所有物件都可使用「顏色刷」功能,支援RAGB的色彩,圖案物件顏色(桌面上的色彩)、漸層、金屬色等等。
支援AJAX用戶交流功能
其可以自己定義的圖表上的重點。支援彈出工具提示、向下縮放、拖曳縮放和拖動滾動。並支援AJAX的Web應用程式,所以可以在不刷新頁面下更新圖表。
瀏覽器的兼容性
產生的PNG、JPEG、BMP、WBMP和GIF檔案。幾乎可以適用所有的瀏覽器,包括行動和手持設備。此外圖表可以嵌入電子郵件、word、PDF中作為圖像。不需要Java或ActiveX組件。
直接進行創建和交付
圖表可以產成並傳遞到瀏覽器,如同HTTP數據。不需要任何暫存的的圖像文件。
增加圖片效能
使用優化色彩還原算法來創建調色板,讓圖片看起來顏色更逼真,且檔案更小。
方便使用
製作圖表只需要短短的幾行代碼。其擁有廣泛的文件檔和大量的範例程式。
國際化
支援Unicode字元。用以配置數量和日期/時間格式。
支援64位元
支援64位操作系統,如Vista 64-bit。
支援ASP/COM/VB/VC;.NET2003/2005;PHP;JSP/JAVA;同時支援Linux。
- ChartDirector Developer License for Windows/Linux/FreeBSD
License for using ChartDirector on one computer/server running Windows, Linux or FreeBSD, for development, production or any other purpose.
Includes one year free upgrade. - ChartDirector Redistribute License for Windows/Linux/FreeBSD
License for royalty free redistribution of ChartDirector runtime on Windows, Linux or FreeBSD. Provides the right to embed ChartDirector runtime in a product or system that is not for ChartDirector software development, and to redistribute that product or system to unlimited number of computers without further royalties to ASE.
Includes one year free upgrade. - ChartDirector Developer License for All Platforms
License for using ChartDirector on one computer/server running any operating system, for development, production or any other purpose.
Includes one year free upgrade. - ChartDirector Redistribute License for All Platforms
License for royalty free redistribution of ChartDirector runtime on any operating system. Provides the right to embed ChartDirector runtime in a product or system that is not for ChartDirector software development, and to redistribute that product or system to unlimited number of computers without further royalties to ASE.
Includes one year free upgrade.
Developer License: for development, production or any other purpose.
Redistribute License:
License for royalty free redistribution. Provides the right to embed ChartDirector runtime in a product or system that is not for ChartDirector software development, and to redistribute that product or system to unlimited number of computers without further royalties to ASE.