
市面第一名 No. 1 的軟體畫出 Sankey 圖
- 以時尚的桑基圖視覺化你的材料、能量和成本流動
- 快速了解即使是最複雜的相互關係
- 決定你可以更有效工作的地點
- 優化你的流程

適用範圍:
數據可視化是簡化和顯示理解數據之間關係的複雜性的好方法。因此,Sankey圖可用於廣泛的應用:
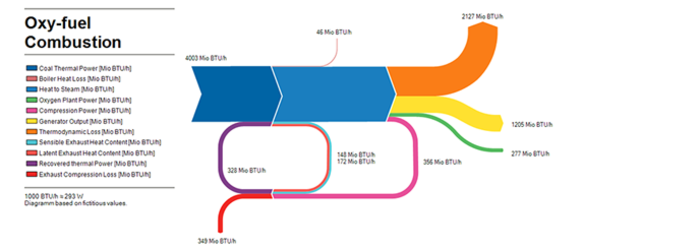
- 能量流(能量平衡),能源效率
- 能源管理和能源審計
- 傳熱,熱損失,熱平衡
- 物料流,例如在生產系統內
- 資源效率,廢物,水/廢水
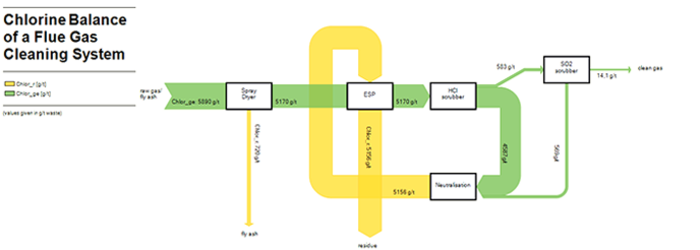
- 加權質量流(即溫室氣體排放,廢氣流中的濃度)
- 物流,貨物運輸,供應鏈分析
- 價值流,成本分配,成本流和可再生價值的可視化
- 業務和營銷分析(例如網絡流量,工作流程優化)
Drawing Sankey diagrams is easy as pie
Building up Sankey diagrams is intuitive and only requires knowledge of a few basic functions of the software:
- Set a process (node)
- Draw an arrow between the processes
- Drag&drop material or energy flow entries into arrow
- Add quantity of material or energy
The correct width of the Sankey arrows is calculated and drawn automatically based on the flow quantities entered. Proportionality and scaling of flows is ensured, even when elements of the diagram are moved.
Free drawing of arrows and nodes ensures a highly customized design.
Many different options for arrows
Once the Sankey diagram with its arrows whose width is proportional to the flow quantity has been set up, it can be adapted and refined. Many different layout options are available in e!Sankey to make the diagram look good:
- Adapt arrow routing: instead of drawing the arrow directly between two nodes insert waypoints to determine the arrow routing. Also, you might want to define that arrows must dock at a specific side of the process symbol
- Design arrow heads: can be turned on or off, shape and size of the arrow spikes can be set
- Icons or images: personalize your diagram using process symbols
Updating Sankey diagrams with data from Microsoft Excel (from e!Sankey pro)
When doing monthly reports, or regularly publishing flow data, it is often sufficient to just update the values in the Sankey diagram.
To this end the Live Link to Microsoft Excel can be used: flows in the diagram reference into cells in a workbook. When these values in Microsoft Excel change, the flow quantities are adapted and the arrows get updated accordingly.
By the way: this mechanism of updating Sankey diagrams with data from external sources can also be automated using e!Sankey SDK. This opens new possibilities to integrate Sankey diagrams in other software solutions, such as e.g. energy management software.
Export of diagrams as image file
After creating your diagram, you can export it as an image file, to show it in a report or to include it in a PowerPoint presentation. Scaling and image resolution can be defined in a dialog. The following graphical file formats are available:
- BMP, GIF, JPG & PNG
- EMF
- SVG (only pro/calc version)
When using the diagram exported to Microsoft Office applications we recommend e.g. the EMF format.
Visualization of stock changes (from e!Sankey pro)
Especially in material flow management visualization of storages & stocks is an important requirement.
To ensure the flow character of Sankey diagrams, you can enter stock values before input & after output. These stocks will be displayed with proportional bars.
Thus you can see stock changes at a glance.
Calculation of entries and flows through process operations (from e!Sankey calc)
Using the following operations you can specify your processes in order to calculate entries and flows in your Sankey diagram, e.g. if certain data is missing:
1. Sum:
Calcuates the sum of all input flows and creates a flow at output arrow.
2. Merge:
Takes all flows from all incoming arrows and passes them to the output arrow. Flows of the same entry will be summed up.
3. Difference:
Calculates the difference of the surrounding flows and creates a flow at the output arrow.
4. Split:
Takes all flows from all input arrows and passes them to the output arros. Flows are split by given ratio.
System requirements: Windows 8.1 or higher, Microsoft .NET 4.8 Framework must be installed, working memory at least 1 GB RAM, 250 MB free disk space. Live Links (in e!Sankey pro & e!Sankey calc) require Microsoft Excel 2016 or higher.
| product features | e!Sankey basic | e!Sankey pro | e!Sankey calc |
| Numerous features for drawing Sankey diagrams | V | V | V |
| Manage flows, units, scaling, colors | V | V | V |
| User interface in 6 different languages (EN, FR, DE, ES, PT, zh-CN) | V | V | V |
| Balance check for input and output flows | V | V | V |
| Export diagrams (BMP, GIF, JPG, PNG, EMF, PDF) | V | V | V |
| Export in SVG vector graphics format | V | V | |
| Live Link to Microsoft Excel | V | V | |
| Visualization of stock changes | V | V | |
| Link files and URLs from diagram elements | V | V | |
| Calculation of flows through process operations | V |
Umberto 物流管理和物流分析軟體
- 提高材料和能源效率
- 達到資源有效的流程
- 減少生產系統對氣候的影響
- 提高產品的可持續性
- Increased resource efficiency and improved environmental performance through efficient material flow management
- Seeing is understanding! The Sankey visualization of material, energy, costs and environmental impact provides transparency for the chosen production system or the entire life cycle.
- Umberto enables finding answers to economic and ecological questions on the basis of a consistent system/model.
版本介紹
UMBERTO EFFICIENCY+
for integrated resource efficiency
- Material flow analyses to increase material and energy efficiency
- Cost accounting to determine potential savings in production
- MFCA to calculate the true cost of material losses
- CO2 balances for tracking and achieving climate targets
UMBERTO LCA+
for integrated environmental assessments
- CO2 balances to determine the climate impact for products and companies
- Life cycle assessments for the calculation of all environmental impacts over the entire product life cycle
- Cost accounting (life cycle costing) with integrated ecological evaluation for eco-efficient decisions