最新版 QCChart2D / QCRTGraph Real-Time Graphics Tools / QCSPCChart SPC

QCSPCChart
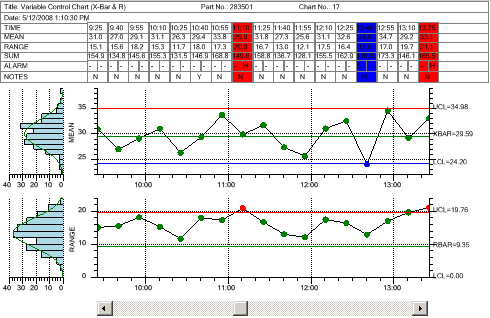
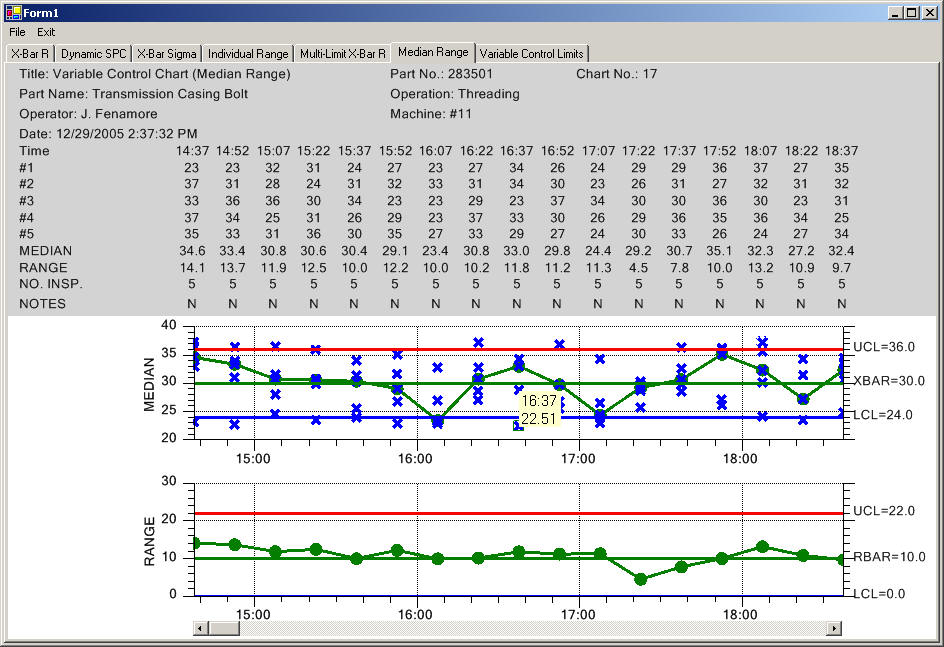
QCSPCChart SPC控制圖工具軟體是一個面向對像的工具,針對那些想添加靜態和動態品質控制圖和Web應用程序開發人員的工作站。典型用戶程式控制工程師和品質控制人員創建將用於監測生產過程的關鍵質量因素,應用和服務行業。工具箱包括最常見的SPC控制圖類型範本:variable control charts (X-Bar R, X-Bar Sigma, Individual Range, Median Range, EWMA, MA, MAMR, MAMS and CuSum charts), attribute control charts (p-, np-, c-, u-, and DPMO charts), frequency histograms, probability charts and Pareto diagrams. The software will automatically calculate SPC control limits using historical data for the supported variable control chart and attribute control chart types. Alarms can be generated for standard +3 sigma control limits, or standard SPC rule sets (WECO, Nelson, Juran, Hughes, Gitlow, AAIG, Westgard and Duncan). It will also calculate process capability ratios (Cp, Cpl, Cpu, Cpk and Cpm) and process performance indices (Pp, Ppl, Ppu and Ppk). Versions available for .Net (VB and C#), WPF (VB and C#), Java, and JavaScript.
QCChart2D Charting Tools for .Net
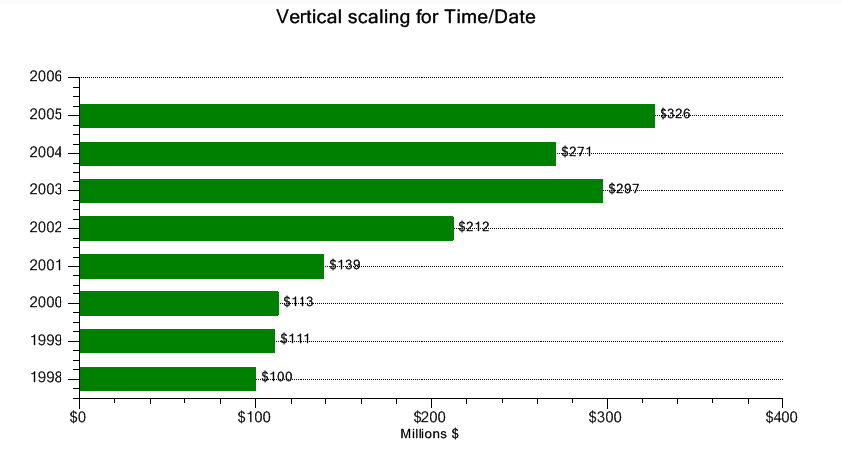
此軟體專為Net的圖表工具包,系統以C#編寫,是對於任何想添加複雜的交互式圖表圖形到Net的應用程式使用者的好幫手。此工具包支援用於工程和科學終端用戶線性,對數,極和天線坐標系等。
.jpg)
Real-Time Graphics Tools for .Net
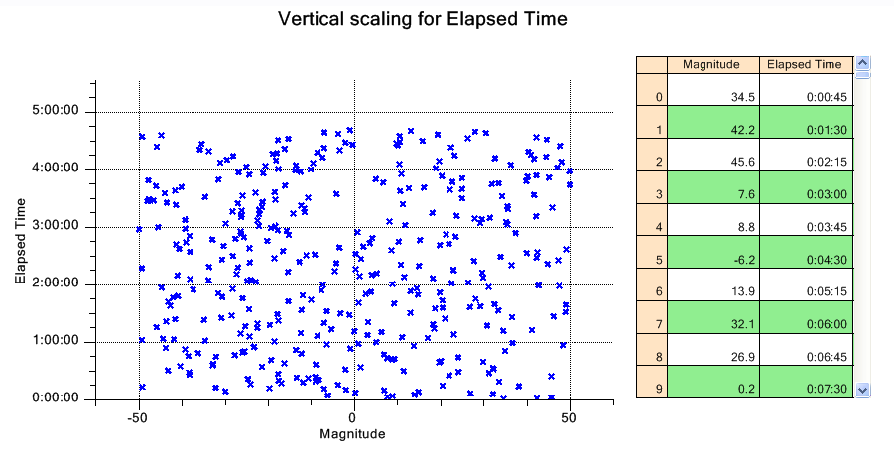
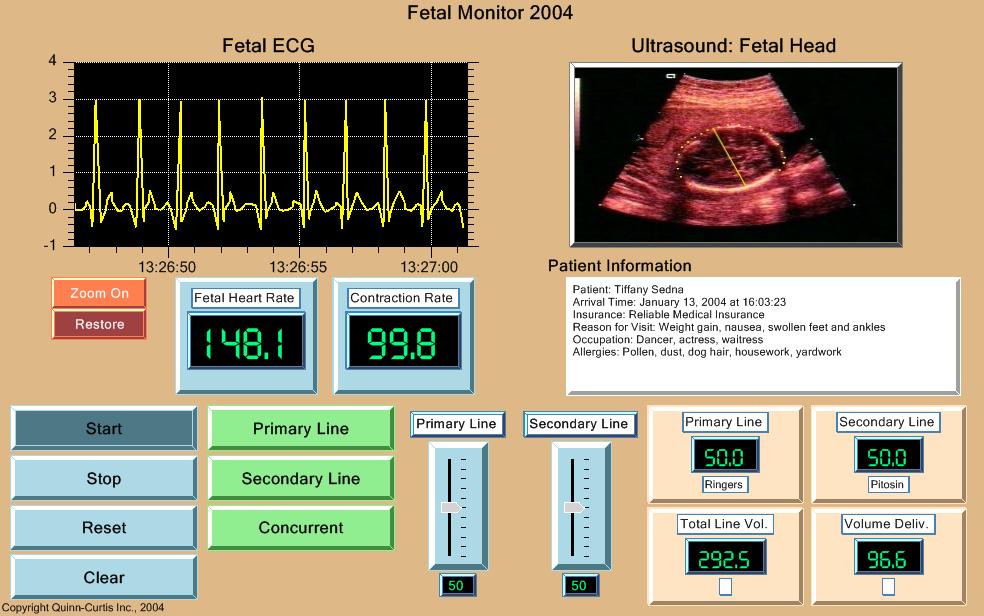
此軟體同樣以C#,是專給對於想添加實時圖形到Windows、.Net和ASP.NET Web應用程序的開發人員。
SPC Control Chart Tools for .Net
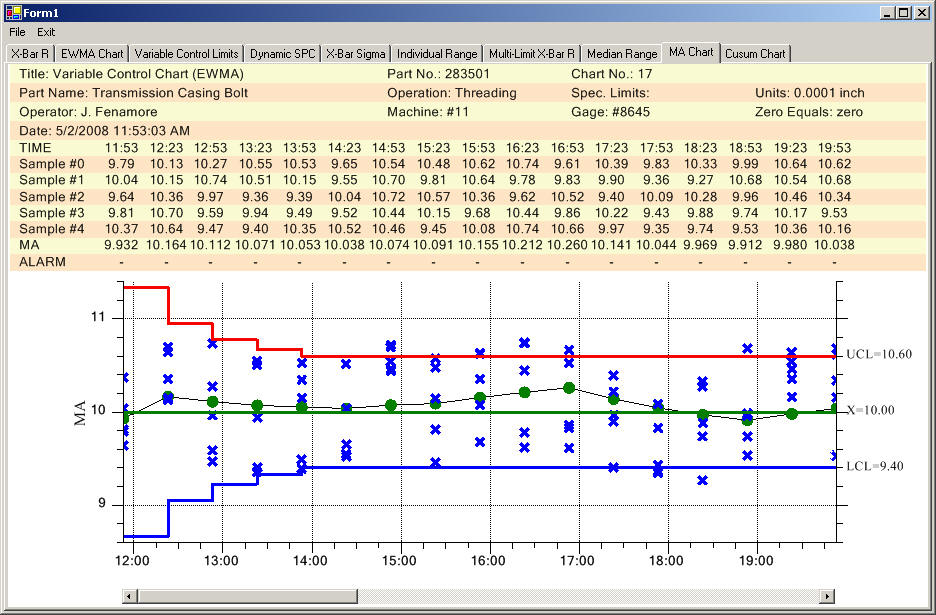
是專給對於任何想把靜態和動態質量控制圖添加到C#和Visual Basic的應用程序開發人員。
QCChart2D Charting Tools for WPF
是對於任何想添加複雜的交互式圖表圖形到WPF的應用程式使用者的好幫手。
Real-Time Graphics Tools for WPF
此軟體同樣以C#,是專們給想添加實時圖形到Windows WPF應用程序的使用者,該軟件集成了QCChart2D製圖軟件,實時數據結構和專業渲染程序。
SPC Control Chart Tools for WPF
專為SPC工程師等質量控制專業人員用戶建立WPF應用程序,使用於監控關鍵質量因素在製造,工藝,服務等行業上。
|
Product / Platform |
Javascript |
Android |
Java |
|
QCChart2D |
X
|
QCChart2D for Android |
QCChart2D for Java |
|
QCRTGraphics |
X
|
QCRTGraph for Android |
QCRTGraph for Java |
|
QCSPCChart |
QCSPCChart for Javascript |
QCSPCChart for Android |
QCSPCChart for Java |
|
QCTAChart |
X
|
X
|
X
|

