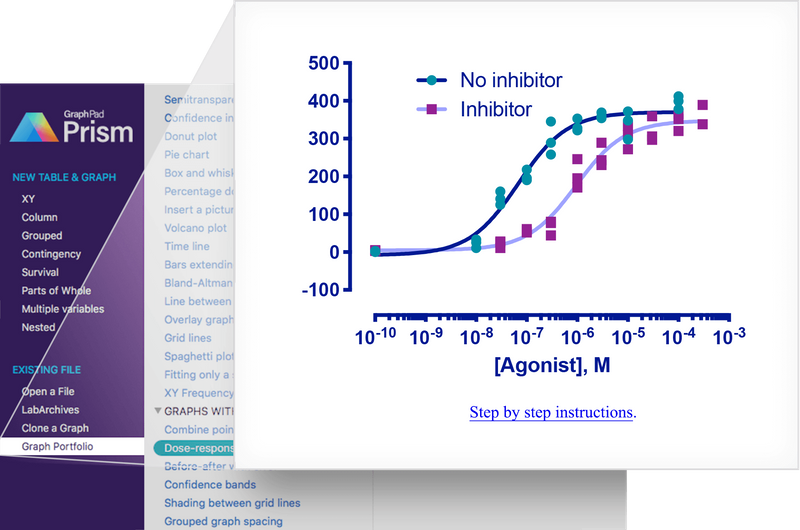
GraphPad Prism 集生物統計、曲線擬合和科技繪圖於一體,其所具有的功能均非常實用和精煉,包括了一些特色的功能,如ROC曲線分析、Bland-Altman分析等;曲線擬合功能是GraphPad Prism超越其他統計軟體的制勝法寶,GraphPad Prism的線性/非線性擬合功能使用操作極其方便,不僅內置了常見的回歸模型,還專門內置了Aadvanced Rradioligand Bbinding, Bacterial Growth, 劑量反映曲線,峰擬合等數十個生物統計模組,GraphPad Prism的繪圖功能也很具特色,無需專門繪製統計圖形,只要輸入資料,圖表自動生成且隨資料改變及時更新,非常方便實用。
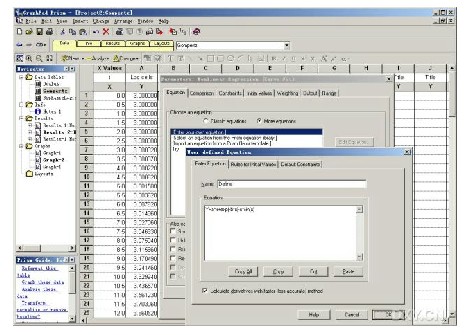
能進行自定義方程曲線擬合的軟體中,GraphPad Prism的操作最為簡便快捷,擬合前參數設置方便,擬合速度快,並支援批量擬合,這在同類軟體中非常少見,可以說GraphPad Prism當之無愧為非線性擬合的高手。
Prism 在科學圖表的繪製方面可以視為Sigmaplot的替代軟體,但是卻又包含了簡單的試算表,可以直接輸入原始數據,軟體自動計算標準差和p value,此外,也包含了其他幾項數值分析的能力。
更新介紹
- Dark mode for macOS: Prism will now adopt your system settings for Dark Mode with re-designed dialogs, toolbars, and table elements in a stylish dark theme
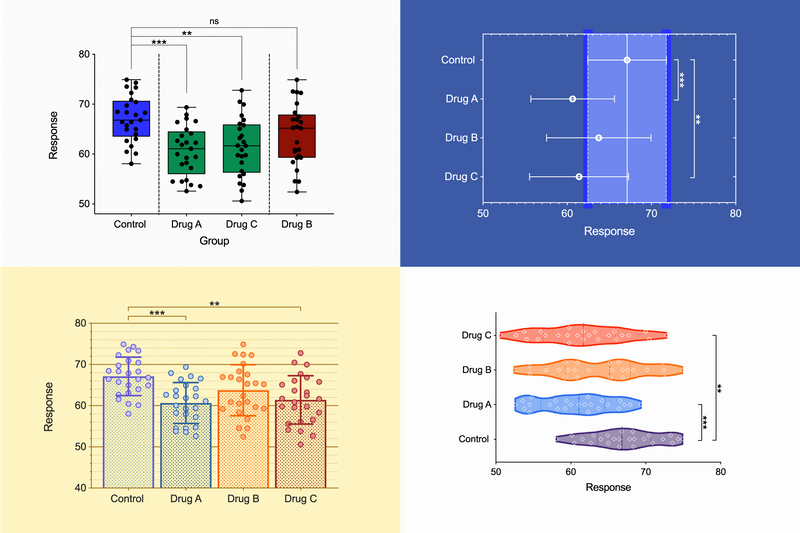
- Compact Letter Display: reduce the clutter on your graphs while presenting your pairwise comparisons from one-way and two-way ANOVA by using letters instead of asterisks to indicate groups with statistically significant differences
- Re-designed Color Scheme menu: view the colors for each color scheme directly in the menu, quickly access recently used color schemes, and browse your own user-defined color schemes
- New Prism Cloud controls: quickly get signed in to your Prism Cloud account and start publishing your work with simplified and more intuitive controls
- And much more!!
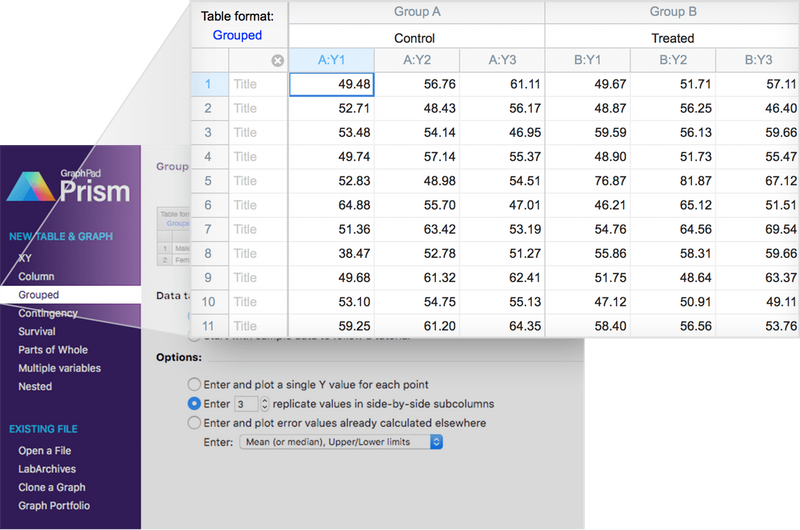
有效地組織您的數據
與電子表格或其他科學圖形程式不同,Prism有八種不同類型的數據表,專門為您要運行的分析而格式化。這樣可以更輕鬆地正確輸入數據,選擇合適的分析並創建令人驚嘆的圖形。
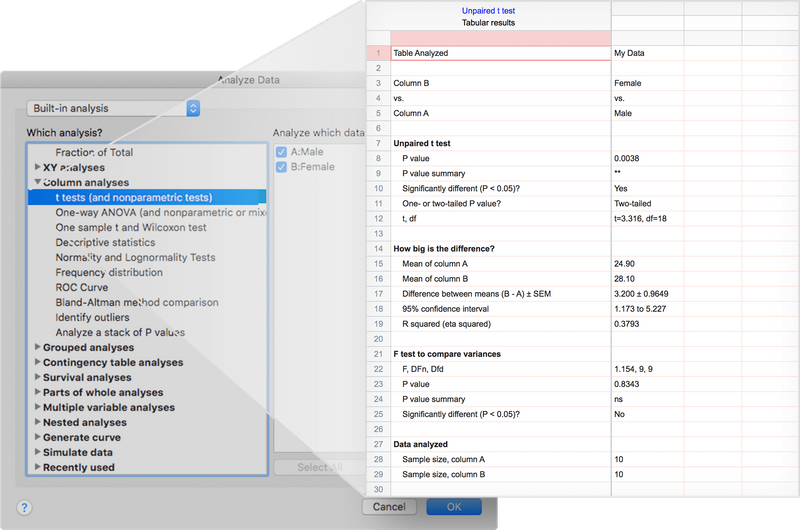
執行正確的分析
避免統計術語。在清晰的語言中,Prism提供了廣泛的分析庫,從常見到高度特異性非線性回歸,t檢驗,非參數比較,單因素,雙因素和三因子方差分析,列聯表,生存分析等等。每個分析都有一個清單,以幫助您了解所需的統計假設,並確認您已選擇適當的測試。
隨時隨地獲得可操作的幫助
降低統計數據的複雜性。Prism的在線幫助超出了您的預期。幾乎每一步,都可以從在線Prism Guides訪問數千頁。瀏覽圖表產品組合,了解如何製作各種圖表類型。教程數據集還可幫助您了解執行某些分析的原因以及如何解釋結果。
一鍵式回歸分析
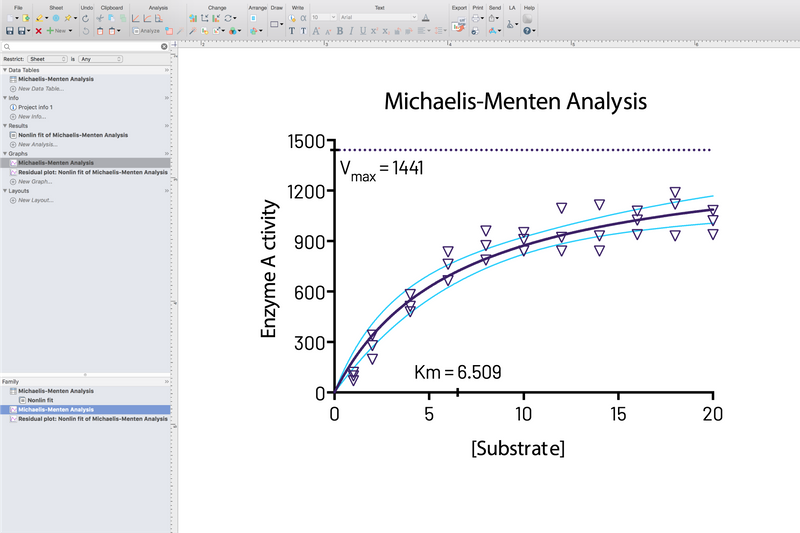
沒有其他程式像Prism那樣簡化曲線擬合。選擇一個方程式,Prism進行曲線的其餘擬合,顯示結果和函數參數表,在圖形上繪製曲線,並插入未知值。
專注於您的研究,而不是您的軟體
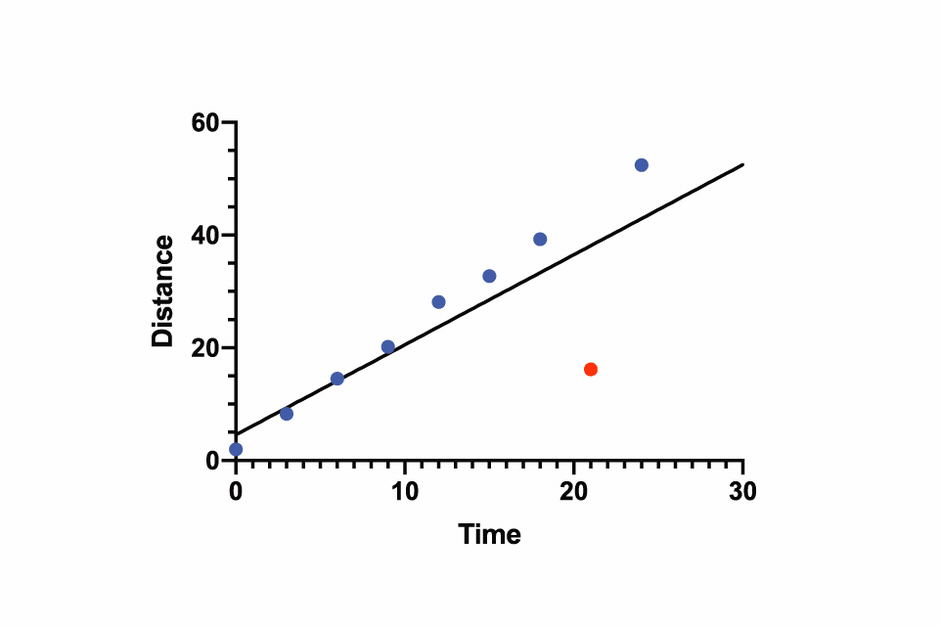
無需編碼。圖表和結果會即時自動更新。對數據和分析的任何更改 - 添加遺漏數據,省略錯誤數據,更正拼寫錯誤或更改分析選擇 - 都會立即反映在結果,圖形和佈局中。
無需編程即可自動完成工作
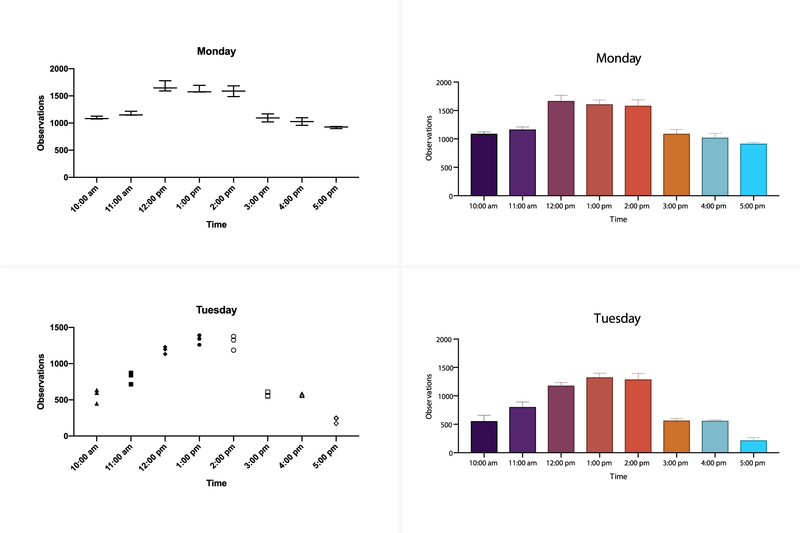
減少分析和繪製一組實驗的繁瑣步驟。通過創建模板,複製系列或克隆圖表可以輕鬆複製您的工作,從而節省您數小時的設置時間。使用Prism Magic一鍵單擊,對一組圖形應用一致的外觀。
無數種自定義圖表的方法
專注於數據中的故事,而不是操縱您的軟體。Prism可以輕鬆創建所需的圖形。選擇圖形類型,並自定義任何部分 - 數據的排列方式,數據點的樣式,標籤,字體,顏色等等。定制選項是無止境的。
一鍵導出出版物 - 質量圖
減少發佈時間。Prism允許您自定義導出(文件類型,分辨率,透明度,尺寸,顏色空間RGB / CMYK)以滿足期刊的要求。設置默認值以節省時間。
加強協作
分享超過您的圖表。Prism對您數據的全面記錄可以與其他科學家進行有效的合作。Prism項目的所有部分(原始數據,分析,結果,圖形和佈局)都包含在一個文件中,您只需單擊一下即可共享。現在,其他人可以在每一步都輕鬆地完成您的工作,提高您的發現的清晰度並簡化您的協作工作。
Prism 10
Prism's requirement are not special, and it will run fine on any computer purchased in the last few years. Here are the details:
Windows
- Operating System. Runs under the 64-bit versions of Windows 10 and 11. Prism 10 does not support 32-bit editions of Windows.
- CPU. x86-64 compatible. Note: Prism Windows is not currently offered in a version compiled to run natively on ARM chipsets (i.e. Qualcomm Snapdragon). However, Prism Windows can run on ARM-powered devices using x64 emulation which is now generally available with Windows 11
- RAM. For comfortable performance and responsiveness, Prism requires the following amount of RAM:
- 2 GB RAM for up to 2 million data cells in currently open Prism files
- 4 GB RAM for 2-8 million data cells
- 8 GB RAM for 8-16 million data cells
- 16 GB RAM for greater than 16 million cells
- Display. The minimum display resolution is 800 x 600, but the recommended display resolution for comfortable work is 1366 x 768.
- HDD. Requires about 100 MB (megabytes) of space on the hard drive.
- Internet. Prism must connect to the internet to verify the license when it is first activated. It will also attempt to connect upon every launch, and every 24 hours if the application is not closed. To continue operating, this connection must be successful once every 30 days (or 20 attempts, whichever comes sooner).
- Additional Information. Prism requires that the Microsoft Edge WebView2 rendering component be installed to correctly display pages in the Welcome Dialog. This is already installed by Microsoft on most new devices, but will be included with the Prism installation if it is missing.
Mac
- Operating System. Runs under macOS X 10.15 (Catalina) or later. If you use macOS 10.14, Prism will launch and seems to run OK, but we haven’t tested Prism thoroughly under this version of macOS and can’t provide much support. If you use 10.14, we urge you to update MacOS.
- CPU. Prism Mac is delivered as a Universal Binary and will run natively on both Apple silicon and Intel-based Mac computers.
- RAM. There is no particular requirement for RAM on Mac. Prism will run fine on all standard configurations of Macs manufactured by Apple.
- Display. Requires a display with a resolution of at least 1024 x 768 pixels.
- HDD. Requires about 130 MB (megabytes) of space on the hard drive..
- Internet. Prism must connect to the internet to verify the license when it is first activated. It will also attempt to connect upon every launch, and every 24 hours if the application is not closed. To continue operating, this connection must be successful once every 30 days (or 20 attempts, whichever comes sooner).
GraphPad Prism 還有一個兄弟產品 GraphPad Instat,兩者配合使用則會使Prism的統計功能極大增強。
GraphPad InStat
絕大多數的統計軟體都是由統計數家來設計的,其目的也是為了方便統計學家的使用。這些軟體都具有各自的個性和極強的功能。但是作為一個普通的科學研究人員,往往被他們那厚厚的說明書、晦澀的統計學術語和高昂的價格所困。與他們不同的是,他是由科學家自己為自己的使用而設計的。下面是你應該選擇的四個理由:
首先,可以一步一步地引導你地使用,這樣就大大方便了你對該軟體的掌握,毫不誇張地說,你甚至可以在幾秒的時間裏學會該軟體的使用。
第二,可以通過對你的資料提出若干問題的方法來幫助你挑選一個合適的測試方法,你甚至沒有必要知道你所需要的測試方法的名字。如果你還沒有把握的話,還可以參考軟體提供的幫助頁面,在裏面你將會得到相關統計原因的解釋。
第三,並不在意你是否是一個專業統計人員,他所最終提供的統計結果是用簡單的語言和很少的統計術語來展示。
第四,通常,在統計軟體中,很容易對一個正確的問題而得到一個錯誤的回答,為此,提供了一種獨特的分析檢測列表。你可以兩次核對那些沒有違反測試假設的資料,以及你所選擇的測試方法,當然該方法應該與你的實驗設計相匹配。
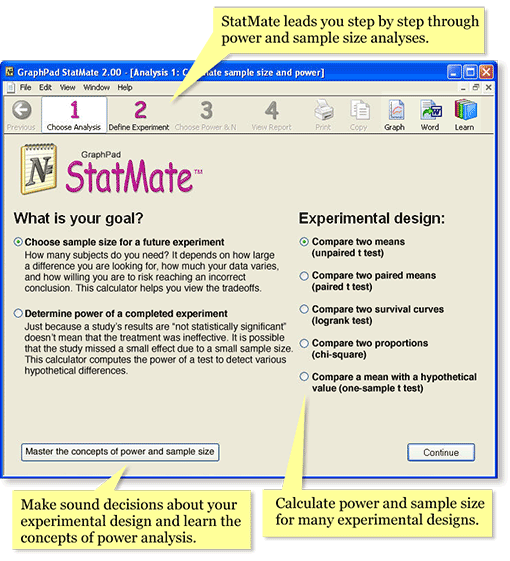
GraphPad StatMate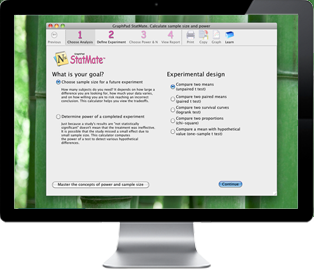
統計軟體,搭配Prism及InStat使用,提供八種統計計算。
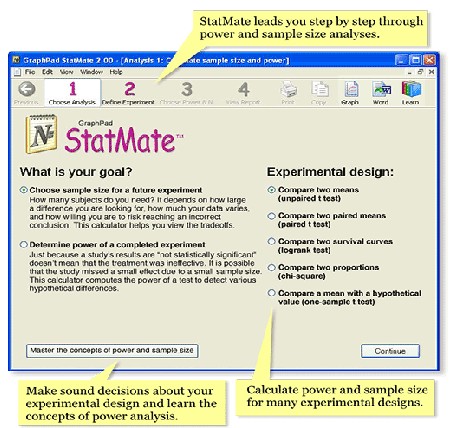
GraphPad StatMate takes the guesswork out of evaluating how many data points you’ll need for an experiment, and makes it easy for you to quickly calculate the power of an experiment to detect various hypothetical differences. Its wizard-based format leads you through the necessary steps to determine the tradeoffs in terms of risks and costs. There is no learning curve with StatMate because it is self-explanatory. All the documentation you need is built right into the program.
Why sample-size matters
Many experiments and clinical trials are run with too few subjects. An underpowered study is wasted effort if even substantial treatment effects go undetected. When planning a study, therefore, you need to choose an appropriate sample size. Your decision depends upon a number of factors including, how scattered you expect your data to be, how willing you are to risk mistakenly finding a difference by chance, and how sure you must be that your study will detect a difference, if it exists.
StatMate shows you the tradeoffs
Some programs ask how much statistical power you desire and how large an effect you are looking for and then tell you what sample size you should use. The problem with this approach is that often you can’t really know this in advance. You want to design a study with very high power to detect very small effects and with a very strict definition of statistical significance. But doing so requires lots of subjects, more than you can afford. StatMate 2 shows you the possibilities and helps you to understand the tradeoffs in terms of risk and cost so you can make sound sample-size and power decisions.
What about power?
You also need to know if your completed experiments have enough power. If an analysis results in a "statistically significant" conclusion, it’s pretty easy to interpret. But interpreting "not statistically significant" results is more difficult. Its never possible to prove that a treatment had zero effect, because tiny differences may go undetected. StatMate shows you the power of your experiment to detect various hypothetical differences.