
Stata 是一套完整、綜合的統計套裝軟體,它提供使用者所需的各種統計分析、資料管理與繪圖功能。
快速, 精準,與更容易使用
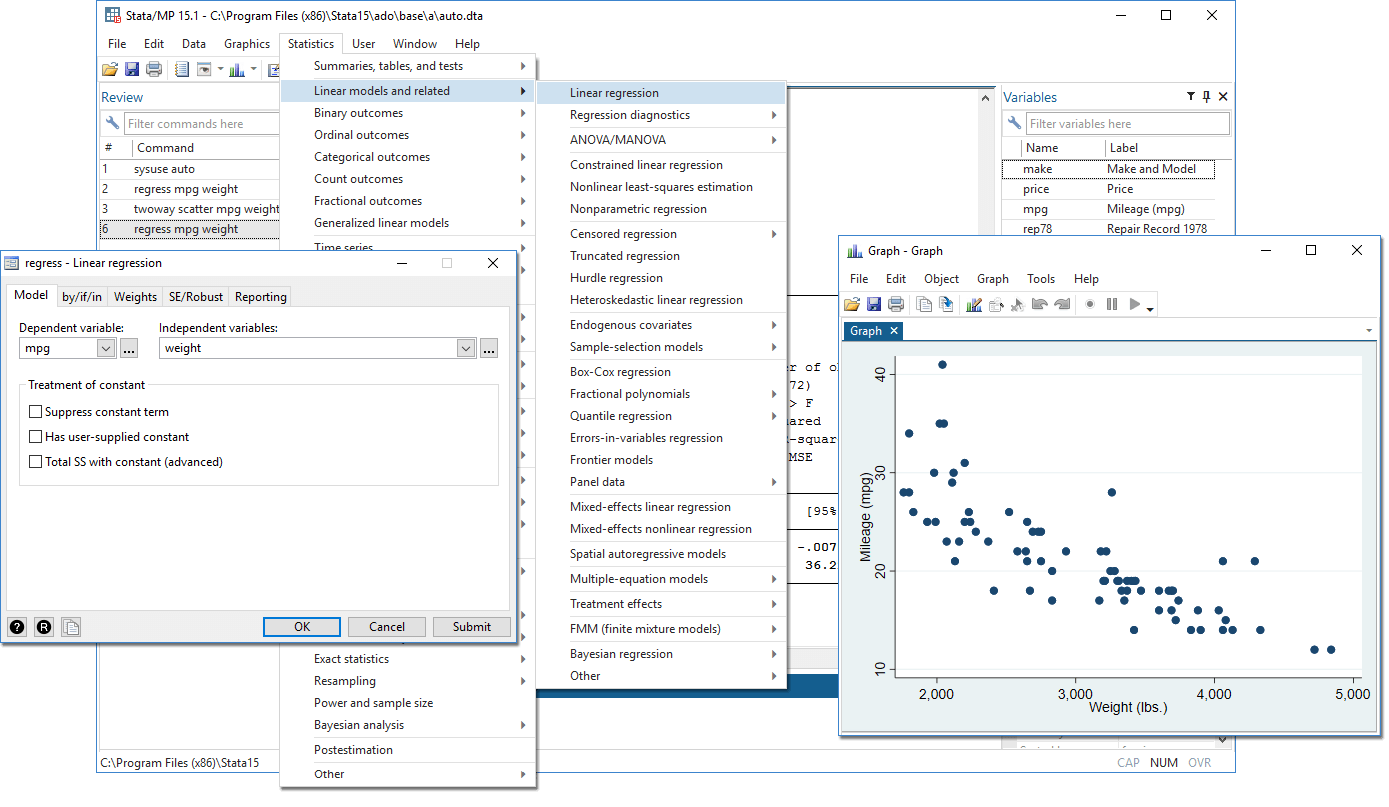
點選式的操作介面、直觀的指令語法與線上協助功能,Stata 在使用上很容易、快速且精準。所有的分析皆可重新複製並文件化,以供發表與回顧。
廣泛的統計分析能力
Stata 放了數百種統計工具供使用者選取,從高階的指令,例如:弱性的存活分析、動態追蹤資料 (DPD) 迴歸、廣義估計方程式 (GEE)、多重混合模型、樣本選擇的模型、ARCH與複雜存活樣本的估計…等,甚至到基本的計算方法,例如:線性與廣義線性模型 (GLM)、結果帶有計數與二元的迴歸、ANOVA/MANOVA、ARIMA、叢集分析、比率標準化、案例控制分析、基本的表格與匯總的統計…等。
完整的資料管理
Stata的數據管理指令可以讓使用者完全控制所有類型的資料:組合與重新規劃資料庫、管理變數、跨組或重複蒐集統計資料。可以針對位元組、整數型、長期的、浮動的、重複的和一連串的變數。Stata也提供進階的工具去管理特殊的資料,例如存活/存續資料、時間序列資料、追蹤/縱向的資料、分類資料與調查資料。
發行不同等級的圖形
使用者可更輕易的編輯出版等級、清晰風格的圖形(Graphics),包含迴歸配適圖形、分布圖、時間序列圖、存活圖。也可藉由點選的方式來修改圖形上的任何部分,或是增加標題、注釋、線、或是文字。使用者可以選擇已經存在的範本或是自行創造。
具有可依賴性質與延伸性
Stata的程式編輯功能使開發人員與使用者可以隨時新增程式特性,來回應現今研究者日益增加的需求。透過Stata的網路功能、新的特性與官方的更新,使用者只要透過點擊,就可以透過網路來下載與安裝。此外,每季Stata Journal都會發表許多新的功能介紹與關於Stata的資訊。另外一個很重要的資源就是Statalist,這是一個獨立的表列式伺服器,每個月都有超過2800個Stata的使用者交換超過1000個訊息與50個程式。
矩陣的程式編輯 – 統合Mata
即使您不需要編輯Stata的程式,您應該會對Stata提供一個快速和完整的矩陣編寫語言的功能感到高興。Mata既是一個操作矩陣的交互環境,也是一個可以用來編譯與優化程式碼的完整開發環境。它包含特殊的功能來處理追蹤資料、操作真實或複雜的矩陣,且完全整合Stata的各方面功能。
交叉平台的通用
Stata可以使用在Windows, Macintosh, 與Unix的電腦上(包含Linux)。其資料庫、程式,與其他的資料皆可以在各平台間分享,使用者不需再作任何資料的轉換,可以快速且輕易的從其他的統計軟體、電子表單還有資料庫中導入資料組。
完整的文件化與其他的出版品
Stata附帶完整的文件資料庫,包含一個超過1800頁的的基本手冊,包含計算公式、詳細的示例,還有統計文獻的索引。Stata官方網站也是一個大型的stata訊息資源,包含使用者最常遇到的Q&A。
使用者能夠在每季的Stata Journal中讀到有關統計與stata新的特性。Stata News是一份每季發行的出版品,內容包含新版本的發表與更新、Netcourse的時間表、新的書籍、用戶組的會議、新產品,以及其他讓stata使用者感到有興趣的公告。Stata Press同樣也會出版關於Stata的使用經驗(books about using Stata)與其他專業研究人員的統計主題內容書籍。
更新介紹
- Bayesian model averaging
- Causal mediation analysis
- Tables of descriptive statistics
- Group sequential designs
- Robust inference for linear models
- Wild cluster bootstrap
- Flexible demand systems
- TVCs with interval-censored Cox model
- GOF plots for survival models
- Lasso for Cox model
- Heterogeneous DID
- Multilevel meta-analysis
- Meta-analysis for prevalence
- Local projections for IRFs
- Model selection for ARIMA and ARFIMA
- RERI
- New spline functions
- Corrected and consistent AICs
- IV fractional probit model
- IV quantile regression
- All-new graph style
- Graph colors by variable
- Alias variables across frames
- Frame sets
- Boost-based regular expressions
- Vectorized numerical integration
- New reporting features
- Do-file Editor enhancements
- Data Editor enhancements
- More
Linear models
regression • censored outcomes • endogenous regressors • bootstrap, jackknife, and robust and cluster–robust variance • wild cluster bootstrap • instrumental variables • three-stage least squares • constraints • quantile regression • GLS • DID • more
Panel/longitudinal data
random and fixed effects with robust standard errors • linear mixed models • random-effects probit • GEE • random- and fixed-effects Poisson • dynamic panel-data models • instrumental variables • DID • panel unit-root tests • more
Multilevel mixed-effects models
continuous, binary, count, and survival outcomes • two-, three-, and higher-level models • generalized linear models • nonlinear models • random intercepts • random slopes • crossed random effects • BLUPs of effects and fitted values • hierarchical models • residual error structures • DDF adjustments • support for survey data • more
Binary, count, and limited outcomes
logistic, probit, tobit • Poisson and negative binomial • conditional, multinomial, nested, ordered, rank-ordered, and stereotype logistic • multinomial probit • zero-inflated and left-truncated models • selection models • marginal effects • more
Choice models
discrete choice • rank-ordered alternatives • conditional logit • multinomial probit • nested logit • mixed logit • panel data • case-specific and alternative-specific predictors • interpret results—expected probabilities, covariate effects, comparisons across alternatives • more
Extended regression models (ERMs)
endogenous covariates • sample selection • nonrandom treatment • panel data • account for problems alone or in combination • continuous, interval-censored, binary, and ordinal outcomes • more
Generalized linear models (GLMs)
ten link functions • user-defined links • seven distributions • ML and IRLS estimation • nine variance estimators • seven residuals • more
Finite mixture models (FMMs)
fmm: prefix for 17 estimators • mixtures of a single estimator • mixtures combining multiple estimators or distributions • continuous, binary, count, ordinal, categorical, censored, truncated, and survival outcomes • more
Spatial autoregressive models
spatial lags of dependent variable, independent variables, and autoregressive errors • fixed and random effects in panel data • endogenous covariates • analyze spillover effects • more
ANOVA/MANOVA
balanced and unbalanced designs • factorial, nested, and mixed designs • repeated measures • marginal means • contrasts • more
Exact statistics
exact logistic and Poisson regression • exact case–control statistics • binomial tests • Fisher’s exact test for r × c tables • more
Epidemiology
standardization of rates • case–control • cohort • matched case–control • Mantel–Haenszel • pharmacokinetics • ROC analysis • ICD-10 • additive models of risk • more
DSGE models
specify models algebraically • solve models • estimate parameters • identification diagnostics • policy and transition matrices • IRFs • dynamic forecasts • Bayesian • more
Tests, predictions, and effects
Wald tests • LR tests • linear and nonlinear combinations • predictions and generalized predictions • marginal means • least-squares means • adjusted means • marginal and partial effects • forecast models • Hausman tests • more
Contrasts, pairwise comparisons, and margins
compare means, intercepts, or slopes • compare with reference category, adjacent category, grand mean, etc. • orthogonal polynomials • multiple-comparison adjustments • graph estimated means and contrasts • interaction plots • more
Resampling and simulation methods
bootstrap • jackknife • Monte Carlo simulation • permutation tests • exact p-values • more
Multivariate methods
factor analysis • principal components • discriminant analysis • rotation • multidimensional scaling • Procrustean analysis • correspondence analysis • biplots • dendrograms • user-extensible analyses • more
Cluster analysis
hierarchical clustering • kmeans and kmedian nonhierarchical clustering • dendrograms • stopping rules • user-extensible analyses • more
Network analysis
nwcommands: import and manipulate networks • generate networks • calculate centrality and dissimilarity measures • visualize networks • more
Time series
ARIMA • ARFIMA • ARCH/GARCH • VAR • VECM • multivariate GARCH • unobserved-components model • dynamic factors • state-space models • Markov-switching models • business calendars • tests for structural breaks • threshold regression • forecasts • impulse–response functions • local projections • unit-root tests • filters and smoothers • rolling and recursive estimation • Bayesian • more
Survival analysis
Kaplan–Meier and Nelson–Aalen estimators • Cox regression (frailty) • parametric models (frailty, random effects) • competing risks • hazards • time-varying covariates • left-, right-, and interval-censoring • Weibull, exponential, and Gompertz models • more
Bayesian analysis
thousands of built-in models • univariate and multivariate models • linear and nonlinear models • panel data • multilevel models • VAR • DSGE • continuous, binary, ordinal, and count outcomes • bayes: prefix for 58 estimation commands • continuous univariate, multivariate, and discrete priors • add your own models • multiple chains • convergence diagnostics • posterior summaries • hypothesis testing • model fit • model comparison • predictions • dynamic forecast • impulse-response functions • more
Bayesian model averaging
full enumeration • MC3 and MH sampling • three model prior classes • fixed and random g-priors for coefficients • heredity rules • PIP for predictors • model ranking by PMP • BMA convergence • variable-inclusion maps • model-size distribution plots • jointness measures • log predictive-score • predictions • more
Meta-analysis
effect sizes • common, fixed, and random effects • forest, funnel, and more plots • subgroup, leave-one-out, and cumulative analysis • meta-regression • small-study effects • publication bias • multivariate • multilevel • more
Power, precision, and sample size
power • sample size • effect size • minimum detectable effect • CI width • means • proportions • variances • correlations • ANOVA • regression • cluster randomized designs • case–control studies • cohort studies • contingency tables • survival analysis • balanced or unbalanced designs • results in tables or graphs • group sequential designs for clinical trials • more
Causal inference/Treatment effects
inverse probability weight (IPW) • doubly robust methods • propensity-score matching • regression adjustment • covariate matching • DID • multilevel treatments • endogenous treatments • average treatment effects (ATEs) • ATEs on the treated (ATETs) • potential-outcome means (POMs) • continuous, binary, count, fractional, and survival outcomes • panel data • lasso • casual mediation analysis • more
Lasso
lasso • elastic net • model selection • prediction • inference • continuous, binary, count, and survival outcomes • cross-validation • adaptive lasso • double selection • partialing out • cross-fit partialing out • double machine learning • endogenous covariates • treatment effects • more
SEM (structural equation modeling)
graphical path diagram builder • standardized and unstandardized estimates • modification indices • direct and indirect effects • continuous, binary, count, ordinal, and survival outcomes • multilevel models • random slopes and intercepts • factor scores, empirical Bayes, and other predictions • groups and tests of invariance • goodness of fit • handles MAR data by FIML • correlated data • survey data • more
Latent class analysis
binary, ordinal, continuous, count, categorical, fractional, and survival items • add covariates to model class membership • combine with SEM path models • expected class proportions • goodness of fit • predictions of class membership • more
Multiple imputation
nine univariate imputation methods • multivariate normal imputation • chained equations • explore pattern of missingness • manage imputed datasets • fit model and pool results • transform parameters • joint tests of parameter estimates • predictions • more
Survey methods
multistage designs • bootstrap, BRR, jackknife, linearized, and SDR variance estimation • poststratification • raking • calibration • DEFF • predictive margins • means, proportions, ratios, totals • summary tables • almost all estimators supported • more
IRT (item response theory)
binary (1PL, 2PL, 3PL), ordinal, and categorical response models • item characteristic curves • test characteristic curves • item information functions • test information functions • multiple-group models • differential item functioning (DIF) • more
Data manipulation
data transformations • data frames • match-merge • import/export data • JDBC • ODBC • SQL • Unicode • by-group processing • append files • sort • row–column transposition • labeling • save results • more
Reporting
reproducible reports • customizable tables • graphical tables builder • Word • Excel • PDF • HTML • dynamic documents • Markdown • Stata results and graphs • SVG • EPS • PNG • TIF • more
Graphics
lines • bars • areas • ranges • contours • confidence intervals • interaction plots • survival plots • publication quality • customize anything • Graph Editor • more
Programming features
adding new commands • scripting • object-oriented programming • menu and dialog-box programming • dynamic documents • Markdown • Project Manager • Python integration • PyStata • Jupyter notebook • Java integration • Java plugins • H2O access • C/C++ plugins • more
Mata—Stata's serious programming language
interactive sessions • large-scale development projects • optimization • matrix inversions • decompositions • eigenvalues and eigenvectors • LAPACK engine • Intel® MKL • real and complex numbers • string matrices • interface to Stata datasets and matrices • numerical derivatives • object-oriented programming • more
Graphical user interface
menus and dialogs for all features • Data Editor • Variables Manager • Graph Editor • Project Manager • Do-file Editor • multiple preference sets • more
Documentation
35 manuals • 18,000+ pages • seamless navigation • thousands of worked examples • quick starts • methods and formulas • references • more
Basic statistics
summaries • cross-tabulations • correlations • z and t tests • equality-of-variance tests • tests of proportions • confidence intervals • factor variables • more
Nonparametric methods
nonparametric regression • Wilcoxon–Mann–Whitney, Wilcoxon signed ranks, and Kruskal–Wallis tests • Cochran–Armitage and other trend tests • Spearman and Kendall correlations • Kolmogorov–Smirnov tests • exact binomial CIs • survival data • ROC analysis • smoothing • bootstrapping • more
Nonlinear regression, GMM and other systems of equations
generalized method of moments (GMM) • nonlinear regression • demand systems • more
Simple maximum likelihood
specify likelihood using simple expressions • no programming required • survey data • standard, robust, bootstrap, and jackknife SEs • matrix estimators • more
Programmable maximum likelihood
user-specified functions • NR, DFP, BFGS, BHHH • OIM, OPG, robust, bootstrap, and jackknife SEs • Wald tests • survey data • numeric or analytic derivatives • more
Other statistical methods
kappa measure of interrater agreement • Cronbach's alpha • stepwise regression • tests of normality • more
Functions
statistical • random-number • mathematical • string • date and time • regular expressions • Unicode • more
Internet capabilities
search and download thousands of community-contributed features (see below) • web updating • web file sharing • latest Stata news • more
Community-contributed features
search and download thousands of free additions • discover new features in the Stata Journal • share commands by posting to the SSC • discuss community-contributed features on Statalist • more
Embedded statistical computations
Numerics by Stata
Installation Qualification
IQ report for regulatory agencies such as the FDA • installation verification
FDA Compliance
Adherence to FDA regulatory requirement for statistical software
Accessibility
Section 508 compliance, accessibility for persons with disabilities
Sample session
A sample session of Stata for Mac, Unix, or Windows.
版本介紹
Whether you’re a student or a seasoned research professional, we have a package designed to suit your needs:
- Stata/MP: The fastest edition of Stata (for quad-core, dual-core, and multicore/multiprocessor computers) that can analyze the largest datasets
- Stata/SE: Standard edition; for larger datasets
- Stata/BE: Basic edition; for mid-sized datasets
- Numerics by Stata: Stata for embedded and web applications
Stata/MP is the fastest and largest edition of Stata. Virtually any current computer can take advantage of the advanced multiprocessing of Stata/MP. This includes the Intel i3, i5, i7, i9, Xeon, Celeron, and AMD multi-core chips. On dual-core chips, Stata/MP runs 40% faster overall and 72% faster where it matters, on the time-consuming estimation commands. With more than two cores or processors, Stata/MP is even faster. Find out more about Stata/MP.
Stata/MP, Stata/SE, and Stata/BE all run on any machine, but Stata/MP runs faster. You can purchase a Stata/MP license for up to the number of cores on your machine (maximum is 64). For example, if your machine has eight cores, you can purchase a Stata/MP license for eight cores, four cores, or two cores.
Stata/MP can also analyze more data than any other edition of Stata. Stata/MP can analyze 10 to 20 billion observations given the current largest computers, and is ready to analyze up to 1 trillion observations once computer hardware catches up.
Stata/SE and Stata/BE differ only in the dataset size that each can analyze. Stata/SE (up to 10,998) and Stata/MP (up to 65,532) can fit models with more independent variables than Stata/BE (up to 798). Stata/SE can analyze up to 2 billion observations.
Stata/BE allows datasets with as many as 2,048 variables and 2 billion observations. Stata/BE can have at most 798 independent variables in a model.
Numerics by Stata can support any of the data sizes listed above in an embedded environment.
All the above editions have the same complete set of features and include PDF documentation.
版本比較
| Product features | Stata/BE | Stata/SE | Stata/MP | ||
| (Basic Edition) | (Standard Edition) | 2-core | 4-core | 6+ | |
| Maximum number of variables | |||||
| Up to 2,048 variables | V | V | V | V | V |
| Up to 32,767 variables | - | V | V | V | V |
| Up to 120,000 variables | - | - | V | V | V |
| Maximum number of observations | |||||
| Up to 2.14 billion | V | V | V | V | V |
| Up to 20 billion | - | - | V | V | V |
| Speed comparisons | |||||
| Fast | V | V | V | V | V |
| Twice as fast | - | - | V | V | V |
| Almost four times as fast | - | - | - | V | V |
| Even faster | - | - | - | - | V |
| Time to run logistic regression with 10 million observations and 20 covariates | |||||
| 20 seconds | V | V | V | V | V |
| 10 seconds | - | - | V | V | V |
| 5.2 seconds | - | - | - | V | V |
| < 5.2 seconds | - | - | - | - | V |
| 798 | V | V | V | V | V |
| 10998 | - | V | V | V | V |
| 65532 | - | - | V | V | V |
| Complete suite of statistical features | V | V | V | V | V |
| Publication-quality graphics | V | V | V | V | V |
| Extensive data management facilities | V | V | V | V | V |
| Truly reproducible research | V | V | V | V | V |
| Comprehensive reporting and table generation | V | V | V | V | V |
| Powerful programming language | V | V | V | V | V |
| Complete PDF documentation | V | V | V | V | V |
| Exceptional technical support | V | V | V | V | V |
| Includes within-release updates | V | V | V | V | V |
| Windows, macOS, and Linux | V | V | V | V | V |
| V | V | V | V | V | |
| Memory requirements | 1 GB | 2 GB | 4 GB | ||
| Disk space requirements | 2 GB | 2 GB | 2 GB | ||
Platforms
Stata for Windows®
- Windows 11*
- Windows 10 *
- Windows Server 2022, 2019, 2016, 2012R2 *
- * Stata requires 64-bit Windows for x86-64 processors made by Intel® or AMD (Core i3 equivalent or better)
Stata for Mac®
- Mac with Apple Silicon or Intel processors
- macOS 11.0 (Big Sur) or newer for Macs with Apple Silicon and macOS 10.13 (High Sierra) or newer for Macs with Intel processors
Stata for Linux
- Any 64-bit (Core i3 equivalent or better) running Linux
- Minimum requirements include the GNU C library (glibc) 2.17 or better and libcurl4
- Check the output of ldd -v within a terminal
- For xstata, you need to have GTK 2.24 installed
Hardware requirements
| Package | Memory | Disk space |
|---|---|---|
| Stata/MP | 4 GB | 2 GB |
| Stata/SE | 2 GB | 2 GB |
| Stata/BE | 1 GB | 2 GB |