最新版 NiCE Active O365 MP 1.20 for Microsoft SCOM
最新版 NiCE Oracle MP 4.10

關於NiCE
NiCE IT Management Solutions 是來自德國的軟體公司,二十年來致力於發掘跨UNIX、Linux、Windows平台的軟體監控方案。在跟合作夥伴HP、Microsoft、Oracle、IBM、BlackBerry的協力與整合下,豐富的經驗化為有形產品,提供您最有力的管理工具。
NiCE的事業起源於多年與HP合作研發Smart Plug-ins(SPIs),有堅實的技術基礎支持,使移植到Microsoft System Center Operation Manager(SCOM)能無縫接軌。現在以Microsoft Enterprise Cloud Alliance Partner的身分,為客戶提供資料庫與通訊軟體的管理包。
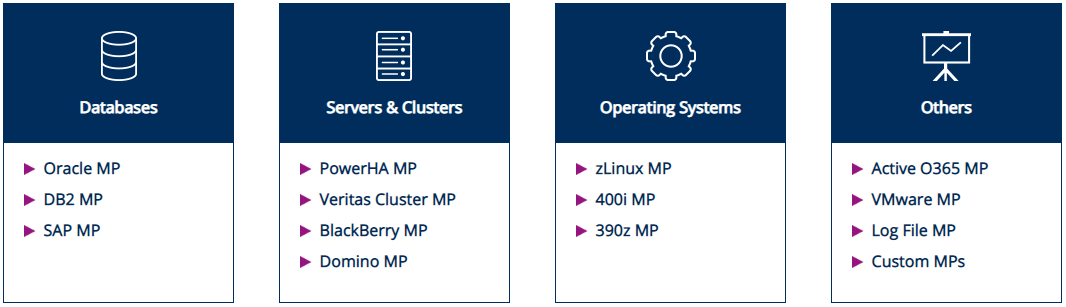
SCOM 2012 SP1 管理包統整列表
NiCE SCOM 管理包在許多論壇、部落格上受到極高評價,並受到專文報導,包括myITforum.com SCOM Management Packs Wiki、The Unofficial System Center Catalog,Microsoft PinPoint上的用戶,以及貴重的客戶們。
為您精選的整合管理包有:
- NiCE Oracle Management Pack
- FREE NiCE Log File Management Pack
- NiCE Domino Management Pack
- NiCE BES 10 Management Pack
- NiCE DB2 Management Pack
- NiCE BlackBerry Management Pack
- NiCE zLinux Management PackSAP Management Pack
Microsoft SCOM Solutions
Monitoring your Mission Critical Business Applications
Microsoft System Center solutions help IT pros manage their physical and virtual information technology environments.
NiCE Management Packs complement this by adding first class application monitoring capabilities.
NiCE Management Packs ensure your business critical applications are at peak performance and availability all the time.
The way your business demands it.
Oracle Database Monitoring
理解和管理您的Oracle環境,就像在物理設計,事務和內存方面不斷變化的生態系統一樣。監控可幫助您在任何給定時間保持平衡,以確保最佳性能。
The NiCE Oracle Database Management Pack allows you to perform a multitude of functions that are critical in your role as system, application or database administrator.
Precise on-time availability alerting
via System Center channels and subscriptions. Alerting is done precisely through a number of core monitors. The Oracle MP provides separate availability monitors for Listeners, Instances (Processes), Databases, Tablespaces and Datafiles.
Support for Enterprise environments
Do you have more than 10 Oracle instances? Or more than 500 tablespaces you need to monitor? You may want to carefully evaluate the monitoring products you use. The NiCE Oracle MP also supports dedicated monitors and discovery for larger environments to keep your System Center datawarehouse in shape. At the same time it gives you detailed alerts, for example, if one of your tablespaces does not have free space left. Further features include: ASM and RMAN monitoring.
Single pane of glass
Monitor and manage your whole environment from a single point of reference. This equates to efficiency and saving time and resources.
Scalable monitoring
Optimize the configuration of your Oracle databases. The Oracle MP includes monitors and reports about current capacity usage and also for capacity planning.
High availability
If Oracle High availability is critical to your business, you can use the build in Oracle Real Application Cluster (RAC) or Data Guard monitors. A number of other cluster technologies are supported.
Oracle Discovery
If you need visibility into your Oracle architecture, you will value the detailed discovery. Not only are Database, Instance, Listeners, Tablespaces and Datafiles discovered, but they are also enriched with configuration information. This includes database levels, regional, language and currency settings, database log mode and also database roles. For RAC and DataGuard environments, separate distributed application views are included as well as state, performance, dashboard and alert views.
Reporting
After you have deployed the Oracle MP you can make use of a set of Oracle Reports.
系統要求
- Microsoft System Center Operations Manager 2012, 2012 SP1, 2012 R2 or 2016
- Microsoft Windows, IBM, AIX, Oracle Solaris, and Linux, HP-UX
- Oracle Database 10g, 11g, 12c
IBM DB2 Database Monitoring
理解和管理您的DB2環境,就像在物理設計,事務和內存方面不斷變化的生態系統一樣。監控可幫助您在任何給定時間保持平衡,以確保最佳性能。
- Unique DB2 monitoring
- In-depth performance views for health indicators
- Concise advice on event management
- Auto-discovery and diagramviews of the DB2 topology
系統要求
- Microsoft System Center Operations Manager 2012 SP1, 2012 R2 or 2016
- Microsoft Windows, Linux, UNIX
- IBM DB2 Version 9.x, 10.x and 11.1
SAP Monitoring
為直接連接的SAP Systems及其應用程序服務器啟用監控,以消除不必要的中斷。
- Built-in failover functionality
- Automatic failover/restore
- Automatic configuration synchronization
- Heterogenous SAP Support
- Connects to SAP systems running on any platform
- Windows Server, Unix, Linux, or IBM I & z systems
- 50-200MB RAM depending on the number of connected SAP systems
The system requirements for our SAP MP are as follows:
- Microsoft System Center Operations Manager 2007 SP1, R2
- Microsoft System Center Operations Manager 2012 (SP1) and 2012 R2
- Windows Server 2003/2008/2012 with .NET Framework 4.0 or later
IBM PowerHA Cluster Monitoring
集群主要用於克服容量短缺,因此您的IT服務與您的服務級別協議保持一致。獲取對您的業務至關重要的受影響PowerHA組件的警報。通過受影響系統的前期操作防止業務損失。
Comprehensive PowerHA Discovery
IBM PowerHA consists of numerous objects like Nodes, Resources, Resource groups and AIX computers. Each object has its own properties like startup policies, service labels, logpaths and identifiers. In a large environment, oversight of important components is easily lost. The ‘out-of-the-box discover’ allows discovery of all PowerHA objects including an extensive list of properties for each object. Utilizing the OpsMgr class model, a full PowerHA inventory model is mapped out. With integrations to SC Service Manager this valuable information is also available with Microsoft System Center Service Manager.
IBM PowerHA Alerting
Incidents impacting high-available infrastructure components must be processed with high urgency. For this reason, the NiCE PowerHA MP includes a number of monitors and alert rules to provide immediate, comprehensive information on impacted components within your PowerHA environment. The NiCE PowerHA MP includes monitoring of 10 different cluster availability states including ‘joining’, ‘barrier’, ‘cbarrier’ and many others. Additionally, if an incorrect configuration is applied to a cluster, the NiCE PowerHA MP has the capability to raise the correct alert instead.
The detailed information given by the NiCE PowerHA MP drastically helps to understand issues and to reduce the mean time to recover.
系統要求
The system requirements for our PowerHA MP are as follows:
- Microsoft System Center Operations Manager 2012 R2 or 2016
- Microsoft Cross-Platform Agents
- IBM AIX
- IBM PowerHA SystemMirror for AIX
Veritas Cluster Monitoring
影響高可用基礎設施組件的事件必須緊急處理。
NiCE Veritas Cluster MP包含監視器和警報規則,可提供有關Veritas Cluster環境中受影響組件的即時且全面的信息。MP極大地幫助您理解問題並縮短平均恢復時間。
Veritas Cluster Server Alerting
Incidents impacting high-available infrastructure components must be processed with high urgency. The NiCE Veritas Cluster MP includes monitors and alert rules to provide immediate, comprehensive information on impacted components within your Veritas Cluster environment.
Included monitoring of core components
- Cluster
- Service Group
- Cluster Resources
- Mount Points
- Cluster File System
The detailed information given by the NiCE Veritas Cluster MP drastically helps to understand issues and to reduce the mean time to recover.
系統要求
- Microsoft System Center Operations Manager 2012 R2 or 2016
- Microsoft Cross-Platform Agents
- Linux (Red Hat, SuSE)
- Veritas Cluster Server
BlackBerry Enterprise Server Monitoring
使用移動設備對於公司的消息服務至關重要,高可用性概念和專業監控都是核心要求。BlackBerry Enterprise MP滿足此要求。它可以為您發現和監控BlackBerry生態系統,以確保隨時獲得最佳的可用性和性能。
The BlackBerry Enterprise MP extends the SCOM view and scope. It ensures fast problem isolation and identification. This in turn ensures a good user experience and promotes productivity and reduced downtime.
Key features
- SRP and database connection monitoring
- Performance and state monitoring for all BES components
- Monitoring of the queue of messages and PIM items in the BES
- Continuous monitoring of the BES logfiles
- Centralized customization and management of critical messages
- Discovery and management of different BES 12 setups
系統要求
- Microsoft System Center Operations Manager 2012 SP1 and later
- BES 12, BES 10, BES 5 Environments
BlackBerry Enterprise Server Monitoring
使用移動設備對於公司的消息服務至關重要,高可用性概念和專業監控都是核心要求。BlackBerry Enterprise MP滿足此要求。它可以為您發現和監控BlackBerry生態系統,以確保隨時獲得最佳的可用性和性能。
- SRP and database connection monitoring
- Performance and state monitoring for all BES components
- Monitoring of the queue of messages and PIM items in the BES
- Continuous monitoring of the BES logfiles
- Centralized customization and management of critical messages
- Discovery and management of different BES 12 setups
系統要求
- Microsoft System Center Operations Manager 2012 SP1 and later
- BES 12, BES 10, BES 5 Environments
Domino Server Monitoring
當使用Domino作為內部和外部通信的主幹,以及作為許多自定義應用程序的基礎時,最重要的是確保所有這些應用程序像集成生態系統一樣工作,以確保最佳的用戶體驗。
- Monitor the Domino Infrastructure easily
- Easy-to-read and easy-to-access web-based reports
- Run reports on performance, availability, workload, operation and bottlenecks
- Run detailed task monitoring of add-in and domino server tasks
- Performance and state monitoring for all Domino components – predefined performance thresholds will ensure that your desired service levels are always met
- Track server response time and transaction measurement
- Chart predefined performance graphs for core metrics
系統要求
The system requirements for our Domino MP are as follows:
- Microsoft System Center Operations Manager 2012 R2,
- 2016 Update Rollup (UR1) and later
- IBM Domino on Windows Version 8.5.x or 9.0.x
zLinux Monitoring
理解和管理您的zLinux環境,就像在物理設計,事務和內存方面不斷變化的生態系統一樣。監控可幫助您在任何給定時間保持平衡,以確保最佳性能。
The NiCE zLinux MP allows you to perform a multitude of functions that are critical in your role as system administrator.
It monitors Red Hat Enterprise Linux Server components such as processes, resources, and server agents.
The monitoring provided by this management pack includes availability and configuration monitoring, performance data collection, and default thresholds. You can integrate the monitoring of Red Hat Enterprise Linux Server components into your service-oriented monitoring scenarios.
In addition to health monitoring capabilities, this management pack includes reports, diagnostics, tasks, and views that enable near real-time diagnosis and resolution of detected issues.
Single pane of glass
Monitor and manage your whole Linux on System Z server environment from a single point of reference. The zLinux MP helps you to manage your Red Hat Enterprise Linux Server computers as part of your System Center 2012 – Operations Manager infrastructure. This equates to efficiency and saving time and resources in the long run.
Precise on-time availability alerting
Through monitors that allow you to see your physical disk health and physical disk performance. Alerting is done precisely through a number of core monitors. The zLinux MP provides separate availability monitors that show the physical disk health and performance states and sends alerts for Red Hat Enterprise Linux Server Physical Disk instances.
Scalable monitoring
Monitor and manage your whole environment from a single point of reference. This equates to efficiency and saving time and resources.
Advanced alerting
The zLinux MP allows you to do both proactive and reactive monitoring of your Linux servers. The MP’s key functionality is to alert you to problems with components such as agents and services so you can continuously monitor the servers and clients on which your business depends. The monitoring provided includes availability and configuration monitoring, performance data collection, and default thresholds. It integrates the monitoring of your Red Hat Enterprise Linux Server components into your service oriented monitoring scenarios.
Reporting
Once the zLinux MP is deployed you can make use of a set of zLinux Reports that graphically show the state of your environment. The MP include reports, diagnostics, tasks, and views that enable close to real-time diagnosis and resolution of detected issues.
Logical Disk Health
Availability and performance monitoring for Logical Disk (File System) instances
Network Adapter Health
Availability and performance monitoring for Network Adapter instances
Operating System Health
Availability and performance monitoring for Red Hat Enterprise Linux Server Operating System instances
Processor Health
Availability and performance monitoring for Processor instances
系統要求
- Microsoft System Center Operations Manager 2012 R2
- Red Hat Enterprise Server 6 on IBM System z (s390x architecture)
400i Monitoring
理解和管理您的IBMi環境,就像在物理設計,事務和內存方面不斷變化的生態系統一樣。監控可幫助您在任何給定時間保持平衡,以確保最佳性能。
The EView 400i MP lets you perform a multitude of functions that are critical in your role as system, application or database administrator.
ISeries (AS/400) Performance Monitoring
Monitor CPU usage, disk usage, ASP, MQ Series, response time, and other performance metrics..
Proactive problem detection and resolution
Two-way communication with iSeries (AS/400) systems to resolve problems quickly and automatically.
Automation Libraries
Out-of-the-box filters provide a “rich starter set” for rapid implementation, as well as automatic closing of any iSeries inquiry message after iSeries operator has replied.
Series (AS/400) Audit Journal monitoring
Real-time monitoring and alerting when critical events occur, allowing security administrators to immediately investigate potential security related issues.
Interface with various Operational functions
System administrators have the ability to interface with the iSeries (AS/400) operational information to manage the system, application jobs, output queues, and spool file.
390z Monitoring
The EView/390z extends the SCOM view and scope. This solution ensures fast problem isolation and identification, which ensures a good user experience and promotes productivity and reduced downtime. Below are some key features and benefits of using the EView/390z
Key features
- Collection sources span any message going through the z/OS operator console.
- Monitor the status and health of the z/OS system and its standard applications.
- IT Operations can display the right information to the right people, at the right time.
- The combination of Microsoft and EView Technology enables TRUE end-to-end IT Enterprise Operations Management.
- Proven technology – successfully deployed in hundreds of enterprise accounts in over 30 countries worldwide.
系統要求
Hardware
EView/390z requires the appropriate Ethernet hardware on the Mainframe (zSeries) to allow for TCP/IP communication with the proxy server.
Additional Disk Space Requirements per machine – System Center Server: 1MB, Proxy Server: 15MB, Mainframe Managed Node: 20MB
Software
Microsoft System Center 2007 R2, 2012, or 2012 SP1.
Windows 2008 Server R2 SP1, or 2013
z/OS release V1R3 or higher
Active Office365 Monitoring
NiCE Active O365管理包(MP)為您提供遠遠超出Office 365 Service Health Dashboard可顯示內容的洞察力。
Office 365租戶基於活動收集的實時用戶信息。
- Comprehensive discovery of hybrid Office 365 deployments
- Active probing for user verification
- Detailed reports on license usage and SLAs
- Built on reliable NiCE components
系統要求
- Microsoft System Center Operations Manager 2012 R2, 2016, 1801
- Microsoft Monitoring Agents
- Support for
- Microsoft Office 365
- Microsoft Exchange Online
- Planned for next versions:
- Microsoft Active Directory Federation Services (ADFS)
- Microsoft Azure Active Directory Connect (AADConnect), Microsoft Forefront Identity Manager (FIM), Microsoft Identity Manager (MIM) and others
- Skype for Business, SharePoint Online
VMware Monitoring
虛擬化是許多IT環境的一部分,是降低費用同時提高效率和靈活性的一種非常有效的方法。
NiCE VMware MP有助於確保VMware vSphere環境的最高性能和可用性。
Discover and monitor the overall health of key components
- Datacenters
- vSphere Clusters
- Hosts
- Datastores
- Networks
- Resource pools
- Virtual Appliances
- Virtual machines
- Disk
- Distributed switches and port groups
Detect and resolve issues fast
- CPU Starvation
- Memory Contention
- Network and Storage latency
- Virtual disk usage
- VMware Tools status
- Snapshot tracking
Leverage Built in Reports
- VMs failing to launch
- High Balloon Driver usage
- High memory swap rates
- Low shared memory levels
- High storage device latency
- Virtual Machine migration projections
- Virtual Machine Inventory
- Resource Pool Memory and CPU utilization
- Cluster Memory and CPU usage
- Datastore capacity
Tracking the vRAM usages helps to ensure maximum efficiency in mitigating the number of VMware licenses.
系統要求
- Microsoft System Center Operations Manager 2012 R2 or later
- VMware vSphere 4.0 and later
Log File Monitoring
The NiCE Log File MP lets you perform a multitude of functions that are critical in your role as system, application or database administrator.
- A powerful program execution interface to run scripts and programs
- An integrated interface which is part of the Microsoft Monitoring Agent
- A program that lets you define log file names as absolute paths
- A program that lets you set an alert on missing log files
- A set of custom authoring wizards which allow you to create;
- Alert Rules
- Performance Counters
- Unit Monitors
系統要求
- Microsoft System Center Operations Manager 2012 (SP1, R2) or 2016
- .NET 3.5.1 Windows Server or later
Custom Application Monitoring
The NiCE building blocks for developing comprehensive Custom Management Packs include standard interfaces for:
- SNMP MIB, incl. complex OID table processing and support for nested tables
- Custom C# Managed Modules for high-performance log analysis
- Experience using Webservices for data collection
- Library MP with numerous customer SCOM datasource Probe- and Action Modules li>
- Experience in developing SCOM Managed Modules
- To really extract the most value out of System Center Operations Manager, one has to create Custom Management Packs.
NiCE has many years of experience in the field of Management Pack development i.e. custom solutions for clients as well as standard Management Packs for Oracle Database, DB2, BES 12, and more. NiCE’s expertise is confined to Windows, UNIX & Linux.
Micro Focus Operations Manager and Operations Bridge Manager Solutions
監控關鍵業務應用程式
Micro Focus Operations Manager解決方案可幫助IT專業人員管理其物理和虛擬信息技術環境。
NiCE智能插件和智能管理包通過增加一流的應用程式監控功能來補充這一點。
NiCE智能插件和智能管理包可確保您的業務關鍵型應用程式始終處於最佳性能和可用性狀態。
您的業務需求方式。
IBM DB2 Database Monitoring
Understand and manage your DB2 environment like an ecosystem that is constantly changing in terms of physical design, transactions, and memory.
Monitoring helps you maintain the balance at any given time to ensure the best possible performance.
The NiCE DB2 SPI is a sophisticated and intelligent Enterprise Ready management pack that fully integrates into OM. The DB2 SPI continuously monitors the DB2 infrastructure, identifying server problems before they affect applications and end users, through the use of predefined event conditions and threshold monitors.
The management pack collects the detailed data that you need from your DB2 instances allowing you to monitor your systems without affecting or impacting their overall performance.
The SPI helps to overcome the main IT admin challenges
- Managing a more and more complex IT environment
- Working efficiently with limited resources
- Diagnosing and addressing problems in real-time
The NiCE DB2 SPI, a cross-platform management pack, gives you in-depth system views which allow you to monitor individual components including DB2 instances (processes), listeners, databases, tablespaces, and datafiles.
In a nutshell
- Unique DB2 monitoring
- In-depth performance views for health indicators
- Concise advice on event management
- Auto-discovery and diagramviews of the DB2 topology
IBM DB2 Database Monitoring
Understand and manage your DB2 environment like an ecosystem that is constantly changing in terms of physical design, transactions, and memory. Monitoring helps you maintain the balance at any given time to ensure the best possible performance.
- Detailed performance views for health indicators
- Concise and precise advice on event management
- State-of-the-art DB2 monitoring
- Easy-to-read and easy-to-access web-based reports
- Auto-discovery and diagram views of the DB2 topology
- Track server response time and transaction measurement
- Chart predefined performance graphs for core metrics
BlackBerry Server Monitoring
When using mobile devices is crucial for your company´s messaging service, both high availability concepts and professional monitoring are a core requirement. The BlackBerry SPI fulfills this requirement. It discovers and monitors the BlackBerry ecosystem for you to ensure the best possible availability and performance at any time.
- Always-on availability
- Provides centralized customization and management of critical messages
- SRP Connection Monitoring
- Performance and state monitoring for all BES components.
- Predefined performance thresholds will ensure that your desired service levels are always met
- Monitors the queue of messages and PIM items in the BES environment
- Continuously monitors the BES logfiles
- Database connection monitoring
- Run reports on performance, availability, workload, operation and bottlenecks
Domino Server Monitoring
When using Domino as the backbone for both internal and external communications, as well as being the basis for lots of customized applications, it is most critical to ensure that all of those applications work like an integrated ecosystem to ensure the best possible user experience.
- Monitor the Domino Infrastructure easily
- Easy-to-read and easy-to-access web-based reports
- Run reports on performance, availability, workload, operation and bottlenecks
- Run detailed task monitoring of add-in and domino server tasks
- Performance and state monitoring for all Domino components – predefined performance thresholds will ensure that your desired service levels are always met
- Track server response time and transaction measurement
- Chart predefined performance graphs for core metrics
390z Monitoring
Integrate IBM Mainframe as a managed node within Micro Focus Operations Bridge to help you configure, provision, monitor, and operate your heterogeneous
- Collection sources span any message going through the z/OS operator console.
- Monitor the status and health of the z/OS system and its standard applications.
- IT Operations can display the right information to the right people, at the right time.
- The combination of Operations Bridge and EView Technology enables TRUE end-to-end IT Enterprise Operations Management.
- Proven technology – successfully deployed in hundreds of enterprise accounts in over 30 countries worldwide.
400i Monitoring
EView/400i’s tight integration extends Operations Bridge Manager’s capabilities to include integration of the IBM iSeries (AS/400) into the overall managed operations environment. EView/400i agents capture system performance statistics, system and application messages, and security related events from the system audit journal and communicates information to the EView/400i proxy server. The result of this integration with Operations Bridge is IT operations can easily troubleshoot, automate, correlate diagnostic data and provide operator and/or automatic recovery.
For many customers, each hour of system downtime can cost the business upwards of hundreds of thousands of dollars. EView/400i tightly coupled with Operations Bridge, brings operations attention to events and conditions at the earliest possible time, facilitating proactive correction of issues before they become problems to end users and customers. This timely resolution of issues directly affects the bottom line and increases the value of IT Operations to the business.
Advanced capabilities include:
- Consolidated Operations Management View.
- Health Monitoring for iSeries (AS/400) Systems and Applications.
- iSeries (AS/400) Performance Monitoring – Monitor CPU usage, disk usage, ASP, response time and other performance metrics.
- Proactive problem detection and resolution – two-way communication with iSeries (AS/400) systems to resolve problems quickly and automatically.
- iSeries (AS/400) Audit Journal monitoring – real-time monitoring and alerting when critical events occur, allowing security administrators to immediately investigate potential security related issues.
The EView/400i solution co-exists with already installed management solutions to reduce the complexity involved in managing the iSeries (AS/400) environments.