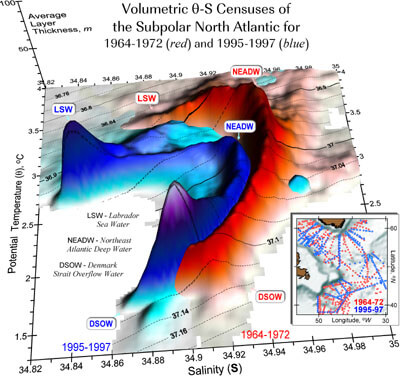
Surfer 快速繪製專業3D影像
Surfer可利用XYZ數據繪製各種等高線圖、三維網格圖、三維表面圖、三維張貼圖、還可做陰影圖、影像圖、向量圖,而且Surfer還能將圖形重疊、將影像圖與3D圖形結合、可選擇多種方格化功能、圖形輸出可選DEX、GIF、EPS,資料匯出或匯入可用Excel、ASCII,另外還可與Grapher搭配,將剖面結果輸出成Grapher之XY圖形,以上皆有教學動畫,是一套功能強大的3D繪圖軟體。
等高線或立體圖、斷面圖:藉由數化而得之地形空間資料,即X,Y座標及高程資料,Surfer以內差方法,將資料規則化,顯示出等高線及立體圖,此外亦可藉由圖形套疊的功能,將規劃區之道路,水系...等圖檔疊在等高線或立體圖上,並可計算土方,及繪出坡面或河道之斷面圖。在坡地水土保持規劃設計上,可達到精確、快速、省工之目的。
功能
- 反轉X 或 Y 座標的方向。
- 資料使用日期/時間格式。
- Z 資料可以用對數刻度(間隔)。
- 下載線上地圖。
- 將 SRF 檔保存為舊版 Surfer 11 格式
- 只需一個步驟就可將地圖匯出。
- 增強post maps。
- 改變測量的單位。
- 新增線條風格。
- 可修改水系圖的盆地線條屬性。
- 在屬性管理器可以修改等值線標注字體/格式。
- 編輯邊界。
- Add Buffer Around Convex Hull when Gridding。
- 匯出等值線可以保存 Z 值。
- 影像圖精準度提高。
- 能處理更大網格。
- 加入更多紙張尺寸。
- 新的導入/匯出格式。
- 新的坐標系統、資料、橢圓體,以及等等。
Powerful Data Interpolation
Have complete confidence in the accuracy of your model. Surfer provides numerous interpolation methods to grid regularly or irregularly spaced data onto a grid or raster, and each interpolation method provides complete control over gridding parameters. Plus, no time is wasted with multithreaded gridding!
Grid 2D XYZ data with 13 powerful algorithms
• Kriging
• Co-Kriging
• Inverse Distance to a Power
• Minimum Curvature
• Natural Neighbor
• Nearest Neighbor
• Polynomail Regression
• Radial Basis Function
• Modified Shepard's Method
• Triangulation with Linear Interpolation
• Moving Average
• Data Metrics
• Local Polynomial
Grid 3D XYZC data with 3 dynamic algorithms
• Inverse Distance to a Power
• Local Polynomial
• Data Metrics
Calculate the TVD of deviated drillholes with 5 calculation methods
• Tangential
• Balanced Tangential
• Minimum Curvature
• Radius of Curvature
• Average Tangential
Computational Analysis Tools
Once your data is interpolated stakeholders are relying on you to understand the project and provide insights that will save them time and money. Surfer empowers you with a robust set of analysis features to extract the most from your data and identify trends, anomalies, or areas of interest.
Grid Convert - convert grid file formats
Grid Math - apply math function to z values and perform functions between grid files
Grid Calculus
• Directional Derivatives
• Terrain Modeling
• Differential and Integral Operators
• Fourier and Spectral Analysis
Grid Transform - modify XY map coordinates
Grid Function - apply user defined Z = f(X,Y) functions
Grid Slice - generate a cross section from a grid
Grid Residuals - compute vertical difference
Point Sample - compute Z values of given XY locations
Contour Volume/Area - compute volume and area above,below, or between contour lines
Calculate Isopach - calculate thickness between surfaces
Grid Mosaic - combine multiple grids into one
Grid Extract - create a subset of an existing grid
Grid Editor - directly edit your grid
• Smooth contours
• Erase areas
• Change nodes to a specific value
• Increase or decrease Z values in an area
Versatile, Publication-Quality Mapping Options
The right figure can solidify the contract. Surfer offers an extensive list of map types for you to visualize and model all types of data. Each map type contains unique, highly customizable properties that give you full control of your final output.
• Base
• Base From Online Server
• Contour
• Post
•Classed Post 3D Surface
• 3D Wireframe
• Color Relief
• Grid Values
• Watershed
• Grid Vector
• Point Cloud
• Viewshed
• Peaks and Depressions
• Drillhole
• Profile
• Graticule
Immersive 3D Modeling
Gain deeper insights into your data by viewing it in three-dimensional space. Surfer’s 3D view makes it easy to model, analyze, and understand all aspects of your data. Switching between Surfer’s 2D and 3D perspectives ensures you discover all of your data’s patterns and provide a memorable presentation.
• Visualize a 3D grid as a volume render or isosurface
• Drape aerial or site plan imagery onto a surface
• Clip 3D grids at custom angles based on XYZ values
• Create a slice through a 3D grid
• Display 3D points, 3D base layers, and grids in a comprehensive model
• Create, edit, and record a fly-through
• Digitize 3D coordinates
• Create 3D Drillhole models
• Export models to 3D PDF and VRMLfiles
Extensive Output Options
Seamlessly visualize and analyze data from multiple sources for multiple industries. Surfer natively reads numerous file formats and supports all popular export formats. Quickly share your work with colleagues, stakeholders, and clients in geology, hydrology, construction and beyond.
• Universally accepted 2D & 3D PDF
• Common drafting & GIS file formats such as SHP, TIF, XLSX, JPG, CSV, KML GRD, DXF, VTK and more
• Comprehensive raster and data file formats
Automate Workflows
Research requires repetition to confirm your findings. Surfer ships with native automation and is compatible with popular third-party applications that wi l help you automate your gridding and mapping workflows.
Surfer is a Windows based, desktop software.
For Mac, Linux, or Unix users, Surfer can be run using your preferred Windows emulator. We recommend testing the functionality with our trial version before purchasing.
Minimum requirements
- Windows 10, 11, or higher
- 64-bit operation system
- 1024x768 or higher monitor resolution with minimum 16-bit color depth
- 500 MB free hard disk space
- 512 MB RAM
- 3D View: Graphics supporting OpenGL v3.2 or later
System recommendations for best performance
- Windows 10, 11, or higher
- 64-bit operating system
- 500 GB or larger hard-drive with at least 25% disk space available, or higher
- 16 GB RAM, or higher
- 3D View: Graphics card (e.g. NVIDIA, AMD, etc)
Optional settings
- Gridding, contouring, and color relief operations, all of which are heavily computational, are processor reliant and are multi-threaded. In Surfer, you will find a setting at File | Options | General | Max number of processors to use. It should be set to use all cores.
- For gridding and contouring operations, CPU performance is important. The more cores the better.
- When working consistently with very large data files, more RAM is important.
- Turning off auto recovery can help performance in some cases. It is OFF by default, but it can be enabled at File | Options | General | Save auto recovery information.
點擊可觀看詳細產品介紹


