產品目錄
產品目錄
3skeng* 是 Trimble SketchUp 的 3D 工程外掛程式。如果你喜歡 SketchUp,你也將喜歡 3skeng。與 SketchUp 一樣直觀,而且容易學習。3skeng 擁有強大的專業功能範圍:
3skeng 是用於 MEP、3D 管道和鋼結構的設計和文件化的。 如果您是工程師、計劃員、HVAC 安裝人員或是管道鉗工、工程師,從事建築科技、廢水、電子、石油、半導體、太陽能、光電子、能源、化學、生命科學、石油化工、水處理、食品、生化、製藥、船舶造船業?
如果設計、工程或安裝管道、鋼結構、電動托盤、固定裝置、通風或排氣系統是您工作的一部分?
如果是,那麼 3skeng 將是您的最佳選擇!
3skeng List
3skeng List為SketchUp添加了電子表格功能。我們全新的程式讓您在基於數據的視圖中與SketchUp實體進行交互和協作。列表,過濾,排序和多重編輯。創建物料清單,零件清單或報告,並將其導出到Excel(.XLSX)。
Ag-grid 是一個企業級的Javascript數據網格。Ag-grid的目的是提供可用於構建企業級的應用,例如報告和數據分析,業務流程和數據輸入的一個數據表格。作者花時間在C ++,Java和JavaScript年構建應用,發現表格插件的選擇在JavaScript中是很必要的
amCharts 提供您最需要的JavaScript/HTML5圖表。amCharts 是用Flash開發的基於Web的圖表軟體產品,amCharts 支援CSV和XML資料類型,同時也支援動態產生的資料,例如PHP, .NET, Java, Ruby on Rails, Perl, ColdFusion等更多的程序語言。因為amCharts是基於flash開發的產品,所以具備了和使用者交互的功能,可以在頁面中隨意改變要顯示的資料。
X/Y
Line & Smoothed line
Area & Range Area
Column & Bar (stacked or clustered)
Scatter & Bubble
Candlestick & OHLC
Step (incl. w/ no-riser)
Floating & Gantt
Waterfall
Error & Control
Stacked (regular or 100%)
Heatmap
Pareto Diagram
Bullet
Dumbbell Plot & Lollipop
Order Book / Depth
Stream & Process Control
Beeswarm
Box Plot
Mekko
Micro & Sparklines
… and any combination of the above
Percent
Pie & Donut
Nested donut
Funnel
Pyramid
Pictorial
Other
Sankey diagram
Chord, Chord directed, and Chord non-ribbon diagrams
Pack
Treemap
Voronoi
Tree
Arc
Sunburst
Partition
Force-directed tree
Radar & Polar
Gauge
Radial Histogram & Heat Map
Flower & Wheel of Life
Word cloud & Sentence cloud
Venn diagram
Infographic
Geo maps
Map chart (flat & globe)
Geo heat map
Tile map
Map combined with charts
Maps is an add-on and requires separate license.
Axialis IconWorkshop 是一款專業的圖標創作工具,可在Windows下運行,讓您輕鬆為所有可用平台和設備創建高品質圖標。使用IconWorkshop,您將能夠為所有作業系統創建圖標,包括Windows,MacOS,Linux,iOS,Android ......此外,這個一體化應用程式還包括處理圖標所需的所有功能:
從頭開始創建或修飾圖標的編輯器
許多工具可以從圖像(PSD,BMP,PNG; SVG ...)創建圖標
一個十字圖標轉換器Windows-Macintosh
15個即用型Photoshop模板,可以像專業人士一樣製作圖標
用於直接從Photoshop和Illustrator傳輸圖稿的插件
Visual Studio加載項可在項目中更快地運行
成千上萬的即用型圖像對象,您可以組合在一起創建圖標等等
Collabion Charts for SharePoint 是一套方便的互動圖表建置軟體,可在您的Sharepoint環境中連結多種資料庫來源使用,不需要搭配其他開發用元件、不需寫任何一行程式。
資料視覺化
不要讓您的資料僅止於一堆未整理的數字。妙手一揮,讓它們說出鮮活故事。
了解資訊內涵
從整理過後的資料觀察模式、發現潮流、找出例外事件,以雕琢出完美策略。
作出最適決策
基於有參考性的資訊作出適當的預測、在資訊充足的情況下作出最適決策。總是在商場競爭中處於領先。
ConceptDraw Office
ConceptDraw Office 包含ConceptDraw MINDMA; ConceptDraw PROJECT and ConceptDraw DIAGRAM
ConceptDraw 是一個建立軟體流程圖、組織表格、時間線和市場報表的工具。該程式有67種與任務相關、可升級的圖庫,合共提供超過1600種用來建立圖示、佈局或電器圖的物件。ConceptDraw是一個跨平台的程式,允許你使用超連接【hyperlink】,並且內建了一個帶有計數功能的電子試算表。該程式的智慧連結模式【Smart Connection Mode】和直接連接模式 【Direct Connection Mode】使得使用者可以很輕鬆的建立大型的流程圖和圖表。該程式支援最佳化的、可點選圖表的 HTML 格式 。
ConceptDraw Office包含一個繪圖平台、心像圖工具以及項目管理工具。這些工具像是業務生成圖、心像圖、項目計劃、儀表板、簡報、圖表、任何可視覺化對業務都非常 重要。這些工具在網路上也可以使用,ConceptDraw 線上解決方案,將提供更多的產品在未來的擴展。這是一個節省時間的助手幫助您的製做出各種高品質的商業文件和簡報,是一個適用於日常工作中資源和任務管理 規劃的強大工具。
ConceptDraw Office中最突出的創新在於,將所有數據和工作狀態的訊息用直觀的方法端到端表現出來,這對於整個工作流程中的每個參與者是最理想的。
ConceptDraw是一個強大的跨平臺應用程序,能夠快速簡單的在你的文檔中創建看起來非常專業的圖表和插圖。你不必是一個專業的圖像製作家,也不需要有任何製圖的經驗,一切可以放心交給ConceptDraw。軟體提供了強大的向量繪圖工具、庫以及許多的內建的圖例形狀,內置描述語言、支持多種格式文檔的輸入輸出、支持連接ODBC數據庫和其它許多的功能。
ConceptDraw Office 軟體包內有流程圖繪製軟體ConceptDraw PRO,思維導圖繪製軟體ConceptDraw MINDMAP以及項目管理軟體ConceptDraw PROJECT,包含全面性的功能。
ConceptDraw OFFICE 包含的軟體:
DIAGRAM - 適用於所有企業的各種專業品質圖形解決方案
MINDMAP - 對戰略規劃,知識和團隊管理至關重要
PROJECT - 提供專業方法投資組合和項目管理
系統需求
System Requirements
macOS
macOS® 12 (Monterey), 13 (Ventura), and 14 (Sonoma)
CPU (macOS 12): Intel
CPU (macOS 13, 14): Intel or Apple Silicon
RAM: minimum 4 GB
HDD: minimum 1.5 GB disk space
Windows
Microsoft Windows® 8.1, 10 (64-bit certified)
CPU: Intel or AMD; 1.8 GHz or higher
RAM: minimum 4 GB
HDD: minimum 1.5 GB disk space
Easy Street Draw
Trancite Easy Street Draw 是一套專門用來繪製交通碰撞事故現場的軟體。在使用的時候,可以從範本中先選取道路或街口形狀,然後再修改或者添加各種形狀的符號。
系統需求
What are the basic system requirements to run Editor, Easy Street Draw, ScenePD, FireScene or ATTAC?
Our applications operate in the Microsoft Windows environment.
The software supports Windows 8/ Windows 10/11
Computer and Processor = 500 MHz or faster processor
Memory = 256 MB RAM or More (512 recommended)
Hard Disk = 2.0 GB or more available disk space
Display = 1024 x 576 or higher resolution monitor
Operating System = Windows 8/ Windows 10, Windows 11 (64 bit only), Windows Server 2008, 2008 R2,2012,2012R2,2016,2019,2022 etc.
Additional Requirements = Microsoft PowerPoint 2013 or higher is required to generate PowerPoint files, Adobe Acrobat Reader is required to view PDF files
Are there any software requirements needed to run Easy Street Editor?
64-Bit requires Microsoft Visual C++ 2017 Redistributable (x64).
Side Note: The EXE installers automatically install the correct Microsoft Visual C++ Redistributable package if it is not already present. The MSI installation packages do not install the Microsoft Visual C++ Redistributable package.
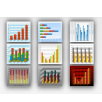
EasyCharts 報表&圖形工具軟件,強大的第三方的報表和圖形工具 擁有無法比擬的畫圖的效果。
EasyCharts是100%基於Java的圖表庫,您可以在你的Java應用程序、網頁、Web的應用程序添加少量的編碼做出非常漂亮的圖表。
EasyCharts支持的圖表和圖表的廣泛組合,是Java開發人員常用的工具,為開發提供了強大,靈活的工具。
Edraw Max 是一個簡單易用的多合一製圖工具,既能實現流程圖、魚骨圖、UML圖、平面圖等280種專業領域圖形圖表的繪製,又提供了白板進行腦力激蕩和任意編排,輕鬆實現數據、創意的可視化呈現。支援多平台,實現一端创作,多端同步。
主要繪製領域:
流程圖、工作流程圖、資料流程圖
組織結構圖
思維導圖,大腦風暴
網路拓撲圖,網路佈線圖
商業圖表
科學儀器圖,物理,化學
工程管理圖,時間線,甘特圖
電子工程圖,電路圖
時裝設計圖
建築設計圖,家居、辦公室平面圖
網站設計圖,概念設計
軟體設計圖, UML
商業卡片設計
資料庫設計圖
地圖,2D方向圖,導航圖等
影片介紹
EngraverIII
用於Photoshop的AlphaPlugins EngraverIII插件
只要幾次點擊滑鼠即可創建看起來像手繪的複雜而美麗的雕刻。具有更快的圖像處理引擎,直觀的界面,多層支持。
AlphaPlugins Engraver III附帶了一組工廠預設,讓您可以直接潛入並嘗試插件的功能。一旦找到合成的完美參數,Engraver III就可以保存下一部傑作的設置。
Grapher 可建立超過40種獨特的2D或3D圖!2D圖有4種不同型態:inear、bar、polar和 specialty graph types。如果你需要一個額外的變量需要表示在你的圖上,可試試3D圖三種型態的其中一種:3D XYZ 圖,等高線圖或者表面地圖!
Create 2D doughnut plots
Create 3D doughnut plots
Create polar vector plots
Create ternary class plots
Create class plots based on text or numbers
Link axes
Set histograms to display cumulative data
Enhanced error bar display
Export fit curves with set spacing and limits
Fully control date/time values
Store last used export settings
Calculate statistics on range of values
Increased file compatibility
Calculate data transforms with text, blanks, and numbers
可視化數據
以最佳方式呈現您的數據。Grapher提供高質量的圖形工具,因此您可以充分利用數據。Grapher提供70多種不同的2D和3D圖形選項,以最好地顯示您的數據。
分析數據
不要錯過任何機會。您的數據可能隱藏了有價值的信息。利用Grapher廣泛的分析圖表,工具和統計功能來識別趨勢,找到新的見解並找到機會。Grapher提供了數據的整體視圖。
Communicate Results
Grapher廣泛的圖表類型選擇和無數的自定義選項使您能夠以您的受眾易於理解的格式傳達您的複雜想法。讓你的數據與Grapher交談。
可靠的解決方案
Grapher受到全球數千名科學家,工程師和商業專業人士的信賴。親自體驗Grapher,看看為什麼這麼多人信任Grapher來展示他們的數據。
更新介紹
New Features and Improvements
Axis Labels: Allow for a coincident major and minor tick label
Category Bar Chart: when creating the plot, the second column of valid data is used instead of the first column
Category Bar Chart: Auto-Enable 'Data in Rows' for Axis Labels When this Checkbox is Enabled for the Plot
Data in Rows: automatically update labels from worksheet when same property changes on plot
Function Plot: Use X axis limits as First/Last value for X=F(Y) plots
Histogram/ Rose/ Wind: Custom bins no longer require all bins to be manually defined
Improve the Custom Bins dialog
Updated sample file: Pie Chart.gpj
GraphPad Prism 集生物統計、曲線擬合和科技繪圖於一體,其所具有的功能均非常實用和精煉,包括了一些特色的功能,如ROC曲線分析、Bland-Altman分析等;曲線擬合功能是GraphPad Prism超越其他統計軟體的制勝法寶,GraphPad Prism的線性/非線性擬合功能使用操作極其方便,不僅內置了常見的回歸模型,還專門內置了Aadvanced Rradioligand Bbinding, Bacterial Growth, 劑量反映曲線,峰擬合等數十個生物統計模組,GraphPad Prism的繪圖功能也很具特色,無需專門繪製統計圖形,只要輸入資料,圖表自動生成且隨資料改變及時更新,非常方便實用。
能進行自定義方程曲線擬合的軟體中,GraphPad Prism的操作最為簡便快捷,擬合前參數設置方便,擬合速度快,並支援批量擬合,這在同類軟體中非常少見,可以說GraphPad Prism當之無愧為非線性擬合的高手。
Prism 在科學圖表的繪製方面可以視為Sigmaplot的替代軟體,但是卻又包含了簡單的試算表,可以直接輸入原始數據,軟體自動計算標準差和p value,此外,也包含了其他幾項數值分析的能力。
更新介紹
Analysis Bug Fixes
(Mac) Fixed the issue in which it was impossible to select the option "Compare row main effect" on the Multiple Comparisons tab of the parameters dialog for Two-way ANOVA while using the Geisser-Greenhouse correction
Other Bug Fixes
– Fixed the issue in which files may potentially become corrupted while using Prism if the system folder used for storing temporary Prism files is write protected
– Fixed the issue in which an unexpected alert appeared when launching Prism offline if a rollback of the system time was detected while using a valid Prism license
– (Mac) Implemented cryptographic routines associated with OpenSSL code within Prism to prevent the GoFetch attach on macOS devices with Apple Silicon
– (Mac) Fixed the issue in which Prism was unable to save a project with corrupted images in the .pzfx format after saving it in the .prism format

