產品目錄

3skeng* 是 Trimble SketchUp 的 3D 工程外掛程式。如果你喜歡 SketchUp,你也將喜歡 3skeng。與 SketchUp 一樣直觀,而且容易學習。3skeng 擁有強大的專業功能範圍:
3skeng 是用於 MEP、3D 管道和鋼結構的設計和文件化的。 如果您是工程師、計劃員、HVAC 安裝人員或是管道鉗工、工程師,從事建築科技、廢水、電子、石油、半導體、太陽能、光電子、能源、化學、生命科學、石油化工、水處理、食品、生化、製藥、船舶造船業?
如果設計、工程或安裝管道、鋼結構、電動托盤、固定裝置、通風或排氣系統是您工作的一部分?
如果是,那麼 3skeng 將是您的最佳選擇!
3skeng List
3skeng List為SketchUp添加了電子表格功能。我們全新的程式讓您在基於數據的視圖中與SketchUp實體進行交互和協作。列表,過濾,排序和多重編輯。創建物料清單,零件清單或報告,並將其導出到Excel(.XLSX)。
AlphaControls Delphi / C++ Builder 開發工具 ── GUI設計開發首選工具
世界各地開發者喜愛使用 AlphaSkins 標準和獨特的元件進行專業GUI設計開發。 AlphaControls是一個易於使用的普及和功能強大的工具,用於開發原有的皮膚和非皮膚的業務/媒體應用。很多額外的屬性和成分使得這個開發組件工具包(以及使用它的應用程式)的獨特。支持 Delphi XE2 .. DX 10.2 Alexandria, Builder XE2 .. CX 10.2 Alexandria
AlphaControls Package
A package of standard and unique components for professional GUI design development using AlphaSkins. AlphaControls is an easy-to-use universal and powerful tool for developing original skinned and non-skinned business/media applications. A lot of additional properties and components makes this package (and the applications that use it) unique.
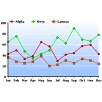
AnyChart 是一靈活的基於Adobe Macromedia Flash的解決方案,可以讓你創建生動的、壓縮的、具有交互性的好看flash圖表。它是跨平臺的圖表解決方案,打算給需要處理創建儀錶板,報表,分析,統計,財務或任何其他資料視覺化 解決方案的任何人使用。AnyChart是完全跨瀏覽器和跨平臺相容,可用於ASP.NET,ASP,PHP,JSP,ColdFusion,Ruby on Rails,簡單HTML頁面或PowerPoint演示。AnyChart 使用 XML 座位元普遍性的資料介面,這樣你可以從任何倉庫中視覺化資料:從文 本,Excel, CSV 格式的檔到 MySQL,MSSQL,和O racle 資料庫伺服器。不需要任何 Flash 技巧或知識,使用你選擇的伺服器或桌面平臺來建購你的程式, 讓你能夠來處理圖表。
主要特色
由XML介面驅動——Anychart為你提供了多個不同的選項,比如設定透明度、顏色、URL鏈結、標題等。您還可以通過XML檔來完成上述選項的自定義,無需修改任何Flash資料源。
無需安裝——您的伺服器無需繪製圖像,無需任何在伺服器上安裝任何Active-X檔,所有圖像都在用戶端生成。用戶端需要安裝有Flash Player,而97%以上的與互聯網連接的電腦上已經安裝有Flash Player。
使用方便——您可以手動創建XML檔。
相容常用的腳本語言(ASP, PHP, ColdFusion, Perl, 等)——您可以使用任何您擅長的語言來創建XML原始檔案並將其傳遞到一個Flash物件,或者僅僅在您的伺服器上使用XML檔。
支援輕鬆的添加背景圖像——您的圖表可以按照您的意願修改!它可以使用一個鏈結的圖像作為背景。
新版更新功能
Interactivity Events In Calendar And Circle Packing Charts
We've upgraded Calendar and Circle Packing charts by integrating a comprehensive suite of interactivity events. Now, you can attach event listeners to any chart element, triggering actions such as adding or changing information and reshaping chart behavior in response to user interactions like mouse movements, hovers, clicks, and more. This enhancement ensures seamless and engaging interactivity in both Circle Packing and Calendar charts, giving you the flexibility to create even more dynamic, informative, and personalized data visualizations of those types with the AnyChart JavaScript charting library.
Why AnyChart?
Driven by XML interface - Anychart offers you a variety of options, such as setting transparency, color, URL linking, captions and more. And you can do all these customizations via an XML File, no Flash source modifications required.
No installation - your server need not render any image, there is no need for any Active-X on the server, all graphing happens on the client side. A Flash Player is installed on more than 97% of Internet-connected PC’s.
Extremely Easy to Use - you can create an XML Data Files manually or using server side scripts.
Compatible with virtually all scripting languages (ASP, PHP, ColdFusion, Perl, etc.) - Use any language you like to create XML Source and pass it to a Flash object, or simply use an XML file from your server.
Constantly growing number of supported chart types - Pie, Bar, Line, Candlestick, Area, Column, Bubble, Spline, Dot/Marker, Scatter, Candlestick, Doughnut, Circular and Linear Gauges and we...

Basic Primitives - JavaScript 圖表開發元件
Basic Primitives is a 100% JavaScript component library for building general purpose diagrams without manual nodes layout.
JavaScript/HTML/PDF Organizational, Family, PERT & Dependencies Chart
支持的圖表:
Hierarchy Visualization 階層視覺化
Organizational Chart 組織架構圖
Multi-parent hierarchical chart 多層次結構圖
Family Tree 家族構成圖
Dependencies Diagram 相依圖
PERT chart 計畫評核圖
Financial Ownership Diagram 財務股權結構圖
.jpg)
BeauGauge Instruments Suite 是套圖形儀表製作的軟體,它可快速的製作各式的虛擬圖表。 並能應用於仿真、科學、儀表、自動化、工業監控等領域,可方便地生成多種多樣的虛擬儀表。 軟件內置多種圖形組件,開發者只需通過滑鼠進行簡單操作,就可製作自己的儀表。內置圖形、儀表樣式豐富。 軟體擁有大量設計精美樣式。 如:圓形表,扇形表,直表,溫度計,數字表,旋鈕,開關,指示燈等等。
系統需求
Supported OS and IDE
Works on Windows 2000 and later platforms of either x86 or x64. (Win 2000, Win XP, Win 2003, Vista, Win 7, Win 8)

Bryntum Scheduler (原為 Ext Scheduler)
您可以利用 Bryntum Scheduler 來安排事情的始末時間及日期。因我們的產品是完全跨瀏覽器,可相容於 IE, Firefox, Chrome, Safari ...等瀏覽器。您也可以利用Ext jS的組件模型(component)和擴展我們的組件,同時建立您自己的插件添加到您自己原本在使用的功能。
我們的產品可以很容易地相容於任何Web應用程式環境:JAVA、PHP、ASP.NET或任何其他網路碼(web stack)中。
特色
General
Easy to localize to support any language.
Unit tested with Siesta
Written using the latest ECMAScript version
Comparison table with Scheduler for Ext JS
Built entirely on web standards: JavaScript, HTML and CSS
Supported browsers: Chrome, Firefox, Safari and modern Edge
Features
Drag drop, resize and create tasks using the mouse or touch
Programmatic validation of any editing actions
Add any custom columns. Inline cell editing supported.
Columns can be sorted using any field or criteria.
Dependencies between tasks (FF/FS/SF/SS)
Zooming from milliseconds to year, customizable zoom levels.
Customize the task look and feel using any HTML + CSS.
Configurable time scale with up to 3 header rows, from ms to years
Support for global time ranges and date indicators
Customizable tooltips using any HTML markup
Export to PDF, PNG and Excel
Read-only mode available
Resource grouping
Summaries
Animated UI updates
Filter tasks or resources easily
Pack, stack or overlapping event layouts
Customizable task labels
Undo & redo
Visual Appearance
Includes a demo showing how to create a custom theme
Predefined task styles and colors to pick from, or apply custom styling using CSS
Row height is customizable, and can be changed dynamically.
Ships with four SASS based themes
Tasks can be easily styled individually by putting CSS classes on the data, or by using the eventRenderer method.
Technical details
Easy to add custom data fields to any of the included Data Model classes (Event, Dependency, Assignment, Resource etc)
Comes with a flexible API where you can override pretty much any part of the codebase
Platform: None, pure JavaScript and framework independent
UMD-bundle for browsers that require transpiled code
UMD-bundle as above but also including babel-polyfill
ES Module-bundle for modern browsers that support ES modules
All bundles are available in minified or unminified versions
Multiple build versions available
Server/Database Integration
Integrates with any server technology (PHP, Java, ASP.NET etc)
Load and save data in JSON. Custom data formats can also be supported.
Demo using PHP backend included
版本比較
Features
Scheduler
Scheduler Pro
Dependencies between events
Purely visual
Affects scheduling
Copy and paste events
V
V
Drag...

Studio FX Premium Subscription產品為年租使用 !!
Development & Desktop Licenses現在統一只提供Studio FX Premium Subscription年租產品!!
Studio FX Premium Subscription 是一套提供給開發者使用的資料視覺化工具軟體。購買後,開發者可以使用所有.NET、Java、COM、SharePoint和Mobility上的全部Software FX公司的開發元件,訂購期間可以於第一時間免費得到新的產品。Software FX的資料視覺化元件是業界領導的產品,代表了最新技術發展趨勢。
可以於任何時候訪問所有的Software FX公司的元件產品,包含:Visual Studio/WPF、Java、COM、SharePoint和Mobile。
針對桌上型產品保有部署的權利,包括Windows Forms,WPF,COM和Java等等。
訂閱期間可以免費獲得升級、Service Packs和產品補丁
優先技術支援和事件追蹤
授權管理和法規遵從
Studio FX Premium Subscription還包括個性化的技術支援中心。
其包含以下組件
Studio FX Premium Subscription includes all the following Desktop and Development Licenses
Visual Studio Products
Chart FX 8
Chart FX 7
Chart FX 7 Extensions Pack
Chart FX for .NET 6.2
Chart FX Extensions Pack for .NET 6.2
Chart FX Gauges
Grid FX
Chart FX for WPF
Chart FX for WPF 8.1
Java Products
Chart FX 7 for Java
Chart FX 8 for Java
Chart FX 6.5 for Java
COM Products
Chart FX 7 for COM
Chart FX for COM 6.2
SharePoint Products
Personal VTC for SharePoint
PowerShell Products
PowerGadgets 1.0
Mobile Products
Chart FX for iOS
PowerGadgets Mobile Server
ChartDirector 控件使用方便、快速、靈活、功能強大、交互性強。在web以及嵌入式應用程序開發中,它是一種非常理想的工具,擁有豐富的圖表圖形組件庫,開發平台支持廣泛,支持ASP/COM/VB/VC;.NET2003/2005;PHP;JSP/JAVA;同時還支持Linux平台
可建立PNG、JPEG、BMP、WBMP和GIF圖表,可以在所有的瀏覽器顯示,包括行動和手持設備。ChartDirector是Windows和Web應用程式的專業圖表組件。ChartDirector生產出的圖表文件體積小巧,一個200×200像素圖表檔案大小只有500-2000b。此外,產出的圖表可以插入電子郵件、word、PDF中。無客戶端Java或ActiveX控件支持AJAX的Web應用程式,所以可以不用重新傳送頁面下更新圖表。多平台:ChartDirector API可用在ASP/ COM / VB、NET、JAVA、PHP、PERL、PYTHON和C++。ChartDirector的ASP/ COM / VB和NET是在Windows上運行。ChartDirector的PHP、PERL、Python、Ruby和C++可在Windows、Linux(i386,x86_64)、FreeBSD(I386)或Solaris(Sparc)上運行。Perl5.6.0或以上可在Mac OS X(PowerPC、Intel)上運行。
廣泛的圖表類型
Pie, donut, bar, line, spline, step line, regression, curve-fitting, inter-line filling, area, band, scatter, bubble, floating box, box-whisker, waterfall, contour, heat map, surface, vector, finance, gantt, radar, polar, rose, pyramid, cone, funnel ... even includes meters and gauges.
分層架構
Multiple chart types can be combined using layers to create customized combo charts. You can also use layers to add symbols to highlight specific points, add markers, thresholds, zones, error bands ... The possibilities are endless.
即時,互動,大數據圖表
Real time charts with programmable track cursors and tooltips. Plot charts with millions of data points. Viewport with zooming and panning facilitates visualization of large data sets. Custom mouse and touch event handlers for chart objects.
PDF, SVG and Images
Apart from displaying on screen, charts be created as PDF and SVG, as well as PNG, JPG, GIF and BMP images. This means you send the charts by email, insert them into reports, or save them as records.
普遍
ChartDirector is suitable for various application types (desktop, web, console, batch, realtime ...) and supports many programming languages and operating systems. This means your investment in ChartDirector will be useful for your current as well as future projects.
更新介紹
New Features
Treemap Chart
TreeMap chart is a new chart type in ChartDirector. A treemap chart is similar to a pie chart. Whereas a pie chart divides a circle into slices, a treemap chart divides a rectangle into multiple rectangles. The child rectangles can be divided into yet more rectangles. So a treemap chart can be used to visualize a tree like data structure with multiple levels of divisions.
Discrete Heat Map
Discrete Heat Map is a new layer type for XYChart. It consists of square or rectangular cells colored based on their data values. Like a contour layer, a discrete heat map layer contains a color axis that maps data values to colors.
Circular Bar Meter
A circular bar meter is like a linear bar meter,...

創建專業的應用程式,結合全套高度制定化用戶介面組件,包括Visual Studio風格的對接窗格,以及Office style Ribbons、工具列以及清單,帶給你的應用程式現代摩登的外觀。
Codejock Toolkit Pro for Visual C++提供Windows開發者一套強大的組件,結合常用的11種組件:Command Bars, Controls, Chart Pro, Calendar, Docking Pane, Property Grid, Report Control, Shortcut Bar, Syntax Edit, Skin Framework以及 Task Panel.
組件:
Command Bars
Comprehensive, fully customizable menus and toolbars.
Controls
Many ready-to-use, thoroughly designed and tested components.
Chart Pro
Advanced chart library includes bar, bubble, gantt, area, and many more!
Calendar
Outlook style calendar and date selection components.
Docking Pane
Fully customizable VS style dockable pane windows.
Property Grid
Comprehensive, fully customizable VS style grid component.
Report Control
Outlook style Reporting grid component.
Shortcut Bar
Outlook style navigation panel component.
Syntax Edit
Visual Studio .NET style text editor component.
Skin Framework
Sophisticated application skinning framework technology.
Task Panel
Office style Task Panel and VS Toolbox control.
系統需求
Development Platform
Visual Studio 2022 ( Visual C++ 17 )
Visual Studio 2019 ( Visual C++ 16 )
Visual Studio 2017 ( Visual C++ 15 )
Visual Studio 2015 ( Visual C++ 14 )
Visual Studio 2013 ( Visual C++ 12 )
Visual Studio 2012 ( Visual C++ 11 )
Visual Studio 2010 ( Visual C++ 10 )
Visual Studio 2008 ( Visual C++ 9 )
Visual Studio 2005 ( Visual C++ 8 )
Visual Studio 2003 ( Visual C++ 7.1 )
Visual Studio 2002 ( Visual C++ 7 )
Visual Studio 6.0 ( Visual C++ 6 )
Windows OS
Windows 11
Windows 10
Windows 8.1
Windows 8
Windows 7
Windows Vista
Windows XP
Windows Me
Windows 2000
Windows 98 SE
Windows 98
Windows 95
Windows Server
Windows Server 2022
Windows Server 2019
Windows Server 2016
Windows Server 2012 R2
Windows Server 2012
Windows Server 2008 R2
Windows Server 2008
Windows Server 2003 R2
Windows Server 2003
Windows Server 2000
Windows NT 4.0
Minimum Requirement
Visual C++ 6.0
Windows 95 / NT 4.0

Codesite 的主要目的是幫助開發者們查找其代碼中的問題。CodeSite 的主要功能是可以讓開發者使用代碼來發送運行時的詳細訊息到特殊的接收器。CodeSite的效率呈現在它不同於簡單的顯示消息的對話框或設定斷點來檢查 變量,它的消息是可持續的,也就是可以保存的。生成發送到目的地的消息的日誌將為你找出代碼中的問題提供相當有用的訊息。此外,在使用對話框和斷點的時 候,發出Codesite訊息並不中斷你的應用程式,因此,Codesite在用戶需要追蹤記錄交互內容的場合裡效率是十分驚人的。

Dw2xls
是一款PowerBuilder資料庫,用來設計Excel格式中匯出Datawindow & Datastore單元格式。
更新介紹
Improved temporary file logic
Alternative way to calculate autosize height (new parameter n_dwr_service_parm.ib_nonvisual_calc_height)
Fixed problem with objects in foreground and background bands for Crosstab DWs
Added workaround for dates before 1900-03-01 which are calculated in Excel in a different way in comparison to OpenOffice and LibreOffice (see new parameter n_dwr_service_parm.ib_fix_date_base)
Allowed to switch ON/OFF dash borders for Grid DWs separately from document gridlines (see new parameter n_dwr_service_parm.ib_draw_dw_grid_lines)
Supported pictures (for OOXML format only)
Fixed problem with Footer band appeared before Summary band
Fixed problem with DDDW when in some conditions Data Column was exported instead of Display Column
FastReport VCL - report generator for Delphi
FastReport VCL提供了創建報表所需的所有工具,包括報表引擎,可視化的報表設計器,預覽窗口,對話框設計工具,以及Pascal-like 巨集解釋程序。
它可用來在Embarcadero(如Borland和CodeGear)Delphi 7-XE8和C++Builder 2005-XE8、Embarcadero RAD Studio 10 Seattle等開發工具。
產品特色:
廣泛全面的報表對象
可視化報表設計器
報表中包含資料集
報表對話框
提供調試工具
可視化查詢產生器
點陣列印報表
生產交叉表
樣式豐富的圖表
多功能的"文字"對象
支援產生下鑽報表
內建的腳本引擎
FastReport VCL 版本比較
Ultimate
Optimum
VCL
Reporting
VCL
Reporting
FMX
Reporting
Lazarus
Analysis
VCL
FastReport Engine
V
V
V
V
V
VCL components
V
V
V
V
FMX components
V
V
Lazarus components
V
V
OLAP features
V
V
V
OLAP aggregation functions
V
V
V
IDE
V
V
V
V
V
V
Graphic core requirements
V
V
V
V
V
Operation System
V
V
V
V
V
V
Script languages
V
V
V
V
V
V
Data connections
V
V
V
V
V
V
Reporting features
V
V
V
V
V
Report objects
V
V
V
V
V
Barcodes
V
V
V
V
V
Charts
V
V
V
V
V
Printing
V
V
V
V
V
Export in formats
V
V
V
V
V
V
Distribution
V
V
V
V
V
V
Support
V
V
V
V
V
V
Source Code
V
V
V
V
V
V
Convertors from
V
V
V
Transports
V
V
Plugin FastConverter .FP3
V
系統需求
Minimum system requirements
Minimum system requirements for installing and using FastReport .NET:
Operating system MS Windows 7-11, Windows Server 2012-2019;
CPU: 1 GHz;
RAM: 512 MB;
You also need the installed .NET Framework version 4.6.2 or higher.