最新版 Basic Primitives Diagram v6.5.1

Basic Primitives - JavaScript 圖表開發元件
Basic Primitives is a 100% JavaScript component library for building general purpose diagrams without manual nodes layout.
JavaScript/HTML/PDF Organizational, Family, PERT & Dependencies Chart
支持的圖表:
- Hierarchy Visualization 階層視覺化
- Organizational Chart 組織架構圖
- Multi-parent hierarchical chart 多層次結構圖
- Family Tree 家族構成圖
- Dependencies Diagram 相依圖
- PERT chart 計畫評核圖
- Financial Ownership Diagram 財務股權結構圖
Pure JavaScript
100% client side JavaScript layout and rendering.
Implemented in popular jQuery UI Widget specification, it has dependencies on jQuery and jQuery UI libraries. It supports composition with existing JQuery UI widgets.
Works in all major browsers Internet Explorer, Chrome, Firefox, Safari and mobile browsers. Supports graphics rendering in VML, SVG and Canvas modes depending on browser. Warning: The web site itself does not support IE6-IE7 so if you need to verify widget in IE6, please download demo archive.
PDF support
100% JavaScript in-browser or NodeJS PDF rendering based PDFkit (MIT) library.
Free for Non-commercial
Do you want to use Basic Primitives Diagram for a personal website, a school site or a non-profit organization? Then you don't need the author's permission, just go on and use Basic Primitives Diagram. For commercial websites and projects, see License and Pricing.
Open
One of the key features of Basic Primitives Diagram that under any of the licenses, free or not, you are allowed to download the source code and make your own edits. This allows personal modifications and a great flexibility. The comprehensive set of samples, demos and unit tests guarantees quality of the library's source code.
Auto layout
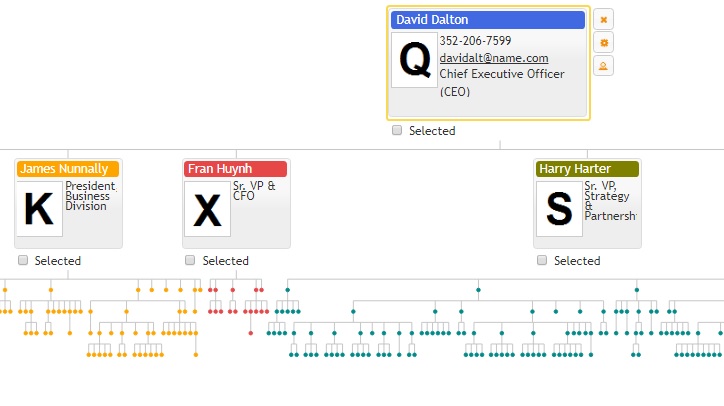
The main problem of diagrams drawn in graphics editor is in sparse distribution of items on layout. Large gaps between nodes make chart hard to overview, edit and navigate. Sometimes the chart is so big that it could have screen size intervals between items. This issue makes the whole idea of visualizing diagrams useless. At the same time computer UI allows to scale and fit visualization into screen, but in that case items become small and unreadable. The primary goal of our approach to Organizational chart and other diagrams visualization is to resolve these issues and make good use of them at the same time. The widget finds the best way to display a large hierarchy within available screen space without scrolling or with minimal scrolling not affecting usability.
- Diagram shape overview. Widget minimizes items in order to fit diagram visualization into available screen space and provides user with possibility to overview general diagram layout.
- User focus navigation goes node by node. Chart displays cursor item and its neighbors full size and minimizes all other less relevant nodes. By clicking on neighboring nodes user will move the focus of interest to the newly selected part of the diagram.
- Pinning of items in diagram. All selected/check marked items are always displayed full size, all other items stay minimized, so it allows to pin/select items in different branches and show them side by side within available screen space for location comparison.
- Diagram design consistency. Auto layout without user's manual editing provides visual consistency across all diagramming documents. All users have various skills and preferences, so auto layout provides consistent diagrams visualization.
- Always up to date. Your application diagrams will not be affected by changes in Widget's layout algorithms and application data. Your visualizations will be always up to date and in sync with your data.
Provides simple API for the most common use cases:
- Default item template has: Title, Image & Description
- Vertical Group Titles
- Selection Check Box
- User buttons panel
- Labels
- Annotations
Flexible API for more complex use cases
- Compatible
- Works with jQuery UI Dragable & Droppable interactions.
- Works in AngularJS directive
- Works in ASP.NET controls
- Customizable item, highlight and cursor content templates.
- Custom layout parent/child relation types: Adviser, Assistant and various partners. Multiple parents, multiple managers or co-heads visualization.
- Custom children and leaves layout: Vertical, Horizontal and Matrix
- Left/Right layout alignment support.
- Events
Dynamic
- Through a full API you can add, remove and modify individual items and their properties at any other time after organizational chart rendering. Widget update time is as fast as its navigation.
Large Organizational Chart / Hierarchy Navigation 組織架構圖
In order to make possible navigation of large hierarchies, widget folds as many nodes as needed in order to fit chart into available screen space. Widget shows full size cursor item and its immediate children and parents, so user can click them and navigate further around current cursor item. Widget supports selected (checked marked) items collection, all of them stay in full size so user can see them all the time during navigation around hierarchy.

Family Tree chart 家族構成圖
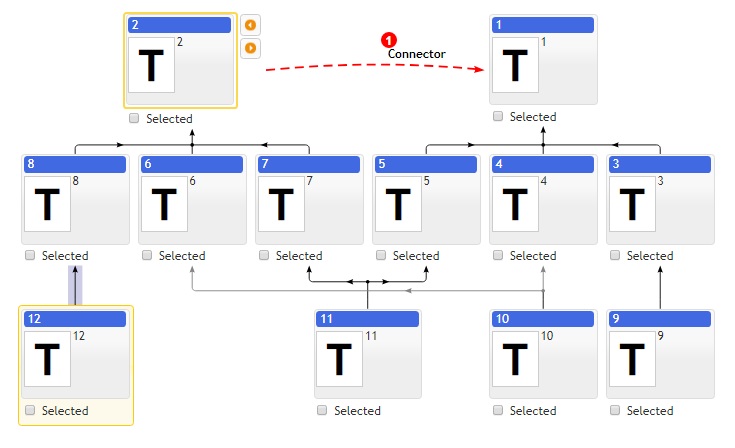
Family chart visualizes multiple inheritance diagram, dependencies diagram and graphs in form of multiple inheritance hierarchy diagram. It bundles parents and children together into one inheritance line where it is possible.
Chart nodes visibility depends on current cursor item. Chart shows all its siblings, children & parents in full item size for easy navigation of large hiearchies. Siblings are nodes which share common parent or child. In other words siblings are child nodes accessable via parent or parent nodes accessable via child. Chart supports loops in inheritance. That means node can be parent of itself. Loop has no logical root so if chart has loops then first item in items collection is used as root. See "Loops" data set.
Widget automatically groups nodes into bundles in order to minimize connection lines clutter in layout. See "Skipped members" data set. Root parents are placed close to their children. See "Side by side" data set.

Financial Ownership Diagram in JavaScript 財務股權結構圖
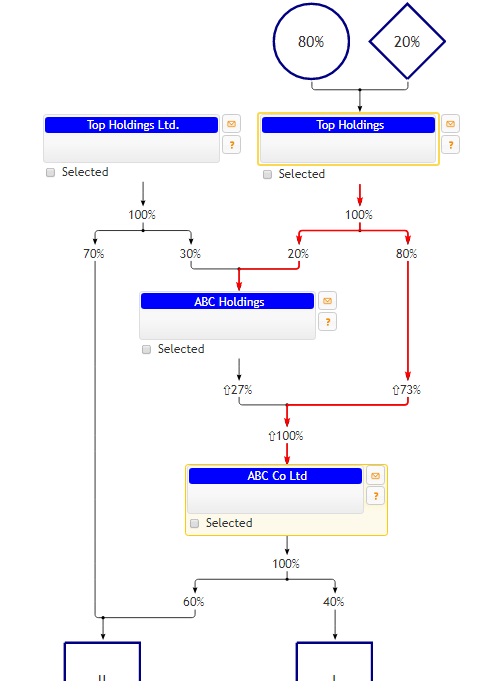
Multiple inheritance diagram visualizing financial ownership. Chart supports following features:
Label annotations placed over connection lines. They are used to show percentage of ownership and form cascades of labels when total value label for several children or parents needs to be shown over individual labels.
Custom item templates having jQuery shape widgets to show geometrical figures. This feature allows to show small multiples or regular bar or line charts inside nodes. Inective items are used to show templated nodes in layout having no user interactivity. They are transarent to cursor node neighbourhood visualization and they are not clickable or selectable. Nodes may have mutial ownership, so widget supports loops in parent child relations. See Family demo sample data sets as well.

Commercial and government licenses
The Basic Primitives Diagram Standard Terms and Conditions are appropriate if you run a commercial website or project, a corporate intranet or a government agency project. It has the following subdivisions:
Single Developer License
Allow one single developer in your company to work with Basic Primitives Diagram.
Allow Basic Primitives Diagram to be used with an unlimited number of SaaS projects, web applications, intranets, and websites for you or your customers.
Source editing allowed.
Each person who directly or indirectly creates an application or user interface containing Basic Primitives Diagram considered a developer.
5 Developer License
Allow Basic Primitives Diagram to be used with an unlimited number of SaaS projects, web applications, intranets, and websites for you or your customers.
Source editing allowed
Each person who directly or indirectly creates an application or user interface containing Basic Primitives Diagram is considered a developer.
10 Developer License
Allow 10 developers in your company to work with Basic Primitives Diagram
Allows Basic Primitives Diagram to be used with an unlimited number of SaaS projects, web applications, intranets, and websites for you or your customers.
Source editing allowed
Each person who directly or indirectly creates an application or user interface containing Basic Primitives Diagram is considered a developer.
