產品目錄
產品目錄
設計/偵錯通信項目是一個非常有壓力又費時的事情。許多軟體/網站工程師在實際可控制序列設備(RS232, RS485, RS422, TTL, Modbus, PLC, SCADA等)之前,都會因為這項協定而讓工作流程停滯不前。
序列協定可以非常複雜,它會要求你不但要理解協定的內容和數據格式(ASCII碼、十六進制、二進制等等),你還必須知道如何做Checksum Calculation(檢查和演算)(檢查是額外的字節,它可以被加在數據字符串的底下,以檢查數據的完整性。校驗和計算各不相同,它可從最簡單xOR到複雜的CRC)。時間是另一個關鍵問題,因為有些協定需要在幾毫秒內確認/回覆。
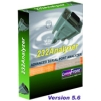
232Analyzer 能幫您解決這些問題,它是一種先進的RS232協定分析軟體,232Analyzer支援數據的輸入和監控,包含ASCII、十六進制、十進制、八進制和二進制格式。它還允許您監視或更改RS - 232交換預設控制信號(Handshaking)線路的狀態,像是RTS, DTR, CTS, DSR, DCD, 和RI。因為有了RS232的端口供電到RS485/RS422或到TTL轉換器,它也可以監視或控制RS485/RS422/TTL設備。它還可以幫助您藉由監視兩個串口設備之間的通信來驗證問題所在。舉個例子來說,232Analyzer允許您直接從您的電腦來控制、監視(間諜)序列埠設備。有了232Analyzer,即使是非技術人員能夠在幾分鐘之內理解和執行的協定。
所有數據和交換預設控制信號流量會被記錄在訊息交流的窗口,它可以被存檔為 .txt、 .doc或 .rtf文件做進一步分析。
232Analyzer有兩種通信模式:偵錯/模擬與監控。偵錯/模擬模式(它的功能作為終端、偵錯器/模擬器)提供了一個簡單的方法來測試你的命令碼,從中你可以發送/接收命令/信號,到/從外部序列設備。監控模式(包括半雙工和全雙工支援)允許您監視(間諜)任何其他兩個序列設備之間的通訊。這個模式提供了毫秒的時間郵戳。所有的數據通訊都會進行錄音,並可以存檔為 .txt、 .rtf或 .doc文件。
232Analyzer 配備了一個先進的校驗和演算器,它允許你做以下演算:
位元智慧邏輯運算:AND, OR, XOR, NOT, Reverse Bit Order
數學計算:+, -, x, \, Mod
CRC-16 (for Modbus)計算
其他先進功能,如可編程按鈕、自動回覆和Macros也包含在裡面。
Why 232Analyzer ?
業界證明
屢獲殊榮的軟體產品,擁有數千名滿意的客戶
比市場上大多數硬體分析儀更多的功能
軟體價格只是硬體分析儀的一小部分。
非常易於使用,無需編程知識。
快速激活,沒有過長的等待時間。
busTRACE 是廣泛的bus(匯流排)與device(裝置)的分析工具,主要使用在系統OEMs,周邊OEMs、軟體開發商、USB 開發商和儲存裝置開發商,全世界用戶都可廣泛使用。
busTRACE 包括強大的分析功能讓您大大的擴展你的能力來分析周邊裝置失敗錯誤的原因與數據。
busTRACE Start Menu
►Select from a list of available busTRACE applications
Capture I/O Activity
►Capture I/O activity on local or remote computers
►Allow remote busTRACE users to capture I/O activity
Generate I/O Activity
►Send a single CDB to a storage device
►Send a sequence of CDBs to a storage device
►Perform a read/write/compare stress test
►View ATA/ATAPI Identify information
►Check for device and I/O subsystem defects
System Information
►busTRACE Storage Manager
►NUMA Node Performance Tester
►CD/DVD Exclusive Access Status
Simulate Device Faults
►Simulate a failure on one or more specified devices
Additional Tools
►View Device Command Descriptor Blocks
►View Device Sense Codes
功能
Start Menu
從可用busTRACE應用程式列表中選擇
Capture I/O Activity
遠端遠端用戶截取I/O
允許遠程用戶busTRACE截取I/O
Generate I/O Activity
傳送單一CDB到儲存設備
傳送系統CDB到儲存設備
執行讀/寫/比較壓力測試
檢視ATA/ ATAPI識別訊息
檢查設備和I / O子系統錯誤測試
System Information
busTRACE 硬碟管理員
NUMA節點效能測試
CD/DVD Exclusive 登入情形
Simulate Device Faults
模擬單一或多個特定設備的錯誤
Additional Tools
View Device Command Descriptor Blocks 瀏覽設備命令列符號
View Device Sense Codes 瀏覽設備檢測代碼
Docklight 是一種序列埠通訊協議的檢測、分析和模擬工具。讓你可以監控兩個序列埠裝置的通訊,或是檢測單一個序列埠裝置的通訊。Docklight 廣泛的被使用在各種工業環境中,包括自動化控制、通訊、汽車、設備製造商和embedded/消費產品上。Docklight可以在Windows 11, 10, 8, 7 作業系統運作。
模擬序列埠協議
記錄RS232數據資料
檢測特定的數據序列
回應傳入的數據資料
延伸的Docklight Scripting軟體提供了一個易於使用的程式語言和一個內建的編輯器來創建並運行自動化檢測工作。Docklight Scripting還具有連網功能,允許TCP或UDP連線。
特色
Docklight RS232 Terminal / RS232 Monitor
Simulating serial protocols - Docklight can send out user-defined sequences according to the protocol used and it can react to incoming sequences. This makes it possible to simulate the behavior of a serial communication device, which is particularly useful for generating test conditions that are hard to reproduce with the original device (e.g. problem conditions).
Logging RS232 data - All serial communication data can be logged using two different file formats: use plain text format for fast logging and storing huge amounts of data. Or create a HTML file with styled text that lets you easily distinguish between incoming and outgoing data or additional information.
Detecting specific data sequences - In many test cases you will need to check for a specific sequence within the RS232 data that indicates a problem condition. Docklight manages a list of such data sequences for you and is able to perform user-defined actions after detecting a sequence, e.g. taking a snapshot of all communication data before and after the error message was received.
Responding to incoming data - Docklight lets you specify user-defined answers to the different communication sequences received. This allows you to build a basic simulator for your serial device within a few minutes. It can also help you to trace a certain error by sending out a diagnostics command after receiving the error message.
Docklight will work with the COM communication ports provided by your Windows operating system. Physically, these ports will be RS232 SUB D9 interfaces in many cases. However, it is also possible to use Docklight for other communication standards such as RS485 and RS422, which have a different electrical design to RS232 but follow the RS232 communication mechanism.
Docklight has been successfully tested with a vast range of serial devices and drivers. This includes many popular USB-to-RS232 converters, Virtual Null Modem drivers like com0com, Bluetooth serial port and modem drivers, Arduino serial ports, and many other Embedded hardware devices that appear as a COM port in the Windows Device Manager.
系統需求
Operating system:
Windows 11, Windows 10, Windows 8, Windows 7
Additional requirements:
Minimum one COM port available. Two COM ports for monitoring communication between two serial devices
For RS232 monitoring using Docklight Tap or Docklight Tap Pro: one USB port
For...
DymaxIO 是快速數據軟體。它是最具成本效益、最易和不可或缺的解決方案,可提高輸送量並加快 I/O 性能,因此系統和應用程式以最高速度運行。DymaxIO 利用 AI(人工智慧)來檢測和部署適用於精確單個系統的適當性能增強技術,以便組織可以在硬體上不超支的情況下提高性能。
DymaxIO消除了Widows環境中的兩個大的I/O效率低下問題,這兩個問題至少會產生30-40%的雜訊I/O流量,從而導致性能和可靠性問題。通過安裝 DymaxIO,企業可以期望在MS-SQL工作負載、Oracle、ERP、VDI、EHR(MEDITECH)、商業智慧(BI)應用程式、CRM、Exchange、SharePoint、檔案伺服器、備份等方面立即提高效能。
Condusiv 保證您將比使用 DymaxIO 的系統獲得更好的性能。如果你想要快速的數據,你想要DymaxIO。無需新硬體,無需重新啟動
I/O Inefficiencies that Rob Performance
There are 2 severe I/O inefficiencies that cause performance and reliability problems.
First, is caused by the behavior of the Windows file system. It will tend to break up writes into separate storage I/Os and send each I/O packet down to the storage layer separately and this causes I/O characteristics that are much smaller, more fractured, more random than they need to be.
Second is storage IO contention, also known as the I/O Blender Effect, which happens when you have multiple systems all sharing the same storage resource, such as multiple VMs all sending small, random I/Os down through the same hypervisor.
Your performance is penalized twice by these storage I/O inefficiencies causing systems to process workloads about 50% slower than they should.
DymaxIO dynamically accelerates data for maximum I/O performance. By solving I/O inefficiencies at the source, DymaxIO
Proactive and Efficient Server Performance Optimization
DymaxIO contains thin file system drivers, that installs (no reboot required) on Windows VMs or physical servers and performs optimizations inline automatically while running transparently in the background with near-zero overhead to the server. What little CPU cycles are needed to run at lowest priority so as not to interfere with server operations in the event that CPU cycles are needed by other applications or processes.
DymaxIO contains a suite of patented technologies that optimize the Windows Storage I/O subsystem so that applications can get to and from the storage layer much faster and process a lot more data.
Some organizations may react to performance challenges by throwing expensive new hardware at the problem. Overbuying and overprovisioning for more IOPS or data throughput might mask the underlying problem for a while, but it does not solve the root cause of performance issues. The quickest, most inexpensive, and least disruptive approach to more performance is simply installing DymaxIO fast data software on all of your Windows systems and watching performance problems disappear.
Keep your Windows systems running better than new with DymaxIO fast data software
• Delivers accelerated I/O performance for Windows systems whether physical, virtual, or in the cloud...
Pc-Check® UEFI – fast, reliable, native UEFI computer hardware diagnostics
Pc-Check UEFI診斷採用全新的工具和應用程序,可以實現更廣泛的測試環境。最終結果:在啟用安全啟動的情況下,可以獨立於操作系統對組件進行可靠的測試和驗證。經過驗證的診斷,能夠協助各種規模的公司和技能,大量的測試功能和無限的使用方法。
Diagnostic ReliabilityPc-Check UEFI Splash Screen
Pc-Check UEFI pre-boots directly to “native” UEFI hardware, giving you clean, pure, precise UEFI component test results you can count on – without an operating system required. Improve PC reliability, decrease technical support calls. Increase customer satisfaction and confidence.
Proof of failure
Reduce component replacement costs by returning faulty components with industry recognized proof of failure reports. Eases customer resistance to test and servicing.
Reporting
XML style test reports allow flexible reporting of diagnostic test results and system information to be printed or stored in a database.
RepeatabilityPc-Check UEFI Motherboard test
Pc-Check UEFI is easy to use by all staff regardless of technical skill level. Create easy to follow test scripts, so your team provides consistent testing every time, saving hundreds of man-hours in fault testing.
Reduce Hardware Returns and NDFs
Guarantee the reliability of all the systems you build, install, or service. Reduce returns and increase profits by ensuring hardware failures are identified before machines leave your process.
Dual Boot Option with Pc-Check Windows +UEFI
Save valuable time by carrying out all of your hardware tests through a single software package. Automatically restart the system into pre-boot UEFI diagnostics. Seamlessly return to Windows for additional testing of driver dependent hardware and reporting. Progressive, native UEFI and Windows testing, giving you “Dual Boot” tools to master all PC hardware problems.
Test Coverage and MaintenancePc-Check UEFI Diagnostic Menu
Pc-Check UEFI directly access and tests all major computer components. Utilizing a proprietary boot loader, signed for security by Microsoft, there is no need to rely on third party boot solutions such as Linux.
How much time are you losing juggling freeware or vendor specific tools to deliver a robust test plan. Are you confident that customers’ PCs are delivered thoroughly tested? Can you easily prove the reliability of your maintenance contracts? Do all your team have easy to follow test plans to provide consistent testing every time?
Leading the way, new Pc-Check UEFI diagnostics serves the widest variety of technical users, testing any UEFI compatible hardware, regardless of brand, whether server, notebook or other PC designs.
Transform your testing with timely, customer-presentable diagnostics. PC manufacturers, servicers, refurbishers, and retailers need to track PC reliability and solve computer problems. Pc-Check UEFI finds problems fast – proves great systems &nda...
Stratus Engineering是工程設計服務公司,專門從事電子產品和軟件嵌入式系統。提供的產品EZ-Tap™ 和 EZ-Tap Pro™ 是用於監測與記錄RS232通訊埠數據,最經濟又簡潔的方案
• Easy-to-use inline passive RS232 connection
• NO bulky cabling
• Standard DB9 connector pinout
• Camera-style "mini-B" connector
• USB access from MS Windows host computer
• Driver software for MS Windows 2000/XP/Vista/7
• FREE data monitoring application software
EZ-Tap™
RS-232 Passive Tap Module
Stratus Engineering's EZ-Tap hardware module is a low-cost hardware solution that uses a traditional dual COM port approach to RS232 interface monitoring.
EZ-Tap is fully compatible with Stratus Engineering's FREE EZ-View monitoring software as well as most 3rd-party dual COM port/ serial port monitoring programs and eliminates bulky cabling typically associated with these solutions.
Baud rates up to 230400*
Purchase EZ-Tap™ Now!*For baud rates above 9600,
we recommend EZ-Tap Pro™ - below.
EZ-Tap Pro™
RS-232 Passive Tap Module
Stratus Engineering's EZ-Tap Pro hardware module RS232 sniffer is a sophisticated hardware solution that overcomes latency and time-tagging problems associated with traditional dual COM port monitoring solutions.
EZ-Tap Pro features state-of-the art electronics that provides extended functionality:
Exact hardware microsecond time tagging of all RS232 data and handshaking events
Captures and time tags state changes on all 6 RS-232 handshaking lines
Supports baud rates up to 921600 bps
Supports 3.3V/5V TTL and RS232 voltage levels
EZ-Tap Pro offers these capabilities at a fraction of the cost of the nearest competitor and is available in the same small, convenient mechanical form factor as the original EZ-Tap module.
LatencyMon 是一款專業的音頻檢測軟體,可檢測出電腦上各個驅動的狀態,特別是聲卡驅動的延遲情況,LatencyMon 檢測出電腦音頻延遲、點擊和持久性噪點的原因,了解聲卡驅動是否適配電腦。LatencyMon 還提供了ISR監視器、DPC監視器和pagefault顯示器的功能,播放音樂和玩遊戲的時候,如聲音播放出現問題的話,LatencyMon可檢測問題原因出自何處,雖不能提供解決方案,卻可以掃描出所有的音頻問題。
The audio latency problem
Windows is not a real-time operating system. All requests to the operating system are delivered on a best effort basis. There are no guarantees whatsoever that requests are delivered within a certain time frame, which are the characteristics of a real-time operating system. That is not a problem for most devices and tasks but this is bad news for audio applications (which are considered soft real-time) because they need to deliver data to the subsystem and the hardware in buffers several times per second. If one or more buffers miss their deadlines and are not delivered in time it has audible consequences which are recognized as dropouts, clicks and pops.
About DPCs and ISRs
The Windows thread dispatcher (also known as scheduler) which is part of the kernel executes threads based on a priority scheme. Threads with higher priority will be given a longer execution time (also known as quantum or time slice) than threads with a lower priority. However the kernel also knows other types of units of execution known as interrupt service routines (ISRs). Devices connected to the system may interrupt on a connected CPU and cause their interrupt service routines to execute. An interrupt can occur on the same processor that an audio program is running on. Any thread that was running on the processor on which an interrupt occurred will be temporarily halted regardless of its priority. The interrupt service routine (ISR) is executed and may schedule a DPC (Deferred Procedure Call) to offload an amount of work. The DPC will most likely run immediately on the same processor which means the audio application will halt until both the ISR and the DPC routines have finished execution. That is because ISRs and DPCs run at elevated IRQL which means they cannot become preempted by the thread dispatcher (scheduler). Therefore to guarantee responsiveness of the system, ISR and DPC routines should execute as fast as possible. Guidelines say that they should not spend more than 100 µs of execution time however this is often not reached due to hardware factors beyond the control of the driver developer. If execution time gets too high, the audio program may be unable to deliver audio buffers to the hardware in a timely manner.
About hard pagefaults
Windows uses a concept of virtual memory which relies on the page translation system provided by the CPU. Whenever a memory address is requested which is not available in physical memory (not resident), an INT 14 will occur. The OS provided INT 14 handler will decide how to proceed next. If the page in which the address...
MOBILedit Forensic 是一款用於從手機、智慧手錶和雲端擷取資料的一體化解決方案。它利用實體和邏輯資料收集,具有出色的應用程式分析、刪除的資料復原、廣泛的支援設備、微調的報告、並發處理和易於使用的介面。 MOBILedit Forensic 採用全新的方法,在安全繞過方面比以往任何時候都強大得多。
MOBILedit Forensic 以其他工具的一小部分價格提供了最大的功能。它可以用作實驗室中的唯一工具,也可以用作其他工具及其資料相容性的增強。當與相機彈道學整合時,它可以科學地分析相機照片的來源。
NetSpot Wi-Fi現場調查,分析,故障排除
WIFI現場調查的主要目標是確定在特定區域實施無線網絡的可行性,並找到接入點和其他設備(如電纜和天線)的最佳位置。在現場調查的幫助下,您將知道要獲取什麼類型的設備以及在哪里安裝它。它將揭示通道干擾和死區的區域,並將幫助你建立堅實的網絡。
WIFI現場調查也是無線安全分析的重要部分。 NetSpot是網絡安全專家在尋找和消除惡意接入點,檢測未經授權的工作站,避免跨渠道干擾並擺脫誤報入侵警報方面的完美幫手。使用NetSpot,您還可以檢查安全設置(開放,WEP,WPA / WPA2個人/企業),非廣播SSID和WiFi信號強度。在所有這些工作都做得很好的情況下,無線信號不太可能外溢。
憑藉其先進的數據收集和可視化功能,NetSpot為其用戶提供了全面而完整的WiFi現場調查解決方案。
Open-AudIT 是一款開源的 IT 資產管理系統
可控管 Windows、Linux、macOS 三大作業系統
可主動、被動搜集電腦資訊
可搜集硬體、軟體資訊
可搜集軟體序號
記錄軟、硬體異動資訊
記錄設備資產資訊
記錄系統管理者修改過程記錄
Oxygen Forensic Detective
Oxygen Forensic Detective套件是一套從行動裝置中檢索眾多的應用程式數據軟體。 在應用程式中,手機取證分析軟體可查看預安裝的列表和由這些程式創建的文件與用戶應用程式。每個應用程式可以包含有價值的用戶數據,如密碼、日誌、歷史記錄、文件等。
系統需求
System Requirements
To use and install Oxygen Forensic® Detective you must, without exception, have administrative privileges on the computer. Do not attempt installation without this right.
The recommended minimum requirements for your computer to complete the setup and run Oxygen Forensic® Detective are:
Minimum Memory: 16 GB DDR4 RAM
Processor: Intel Core i7
Minimum USB Ports: 2x USB 3.0
Storage: Minimum 500 GB SSD
Microsoft Windows 64-bit Operating System
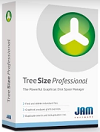
TreeSize Professional 是一款 Windows 下强大靈活的硬碟空間管理工具。它可以幫你找出硬碟上最大的目錄以及它占用的空間。TreeSize Professional 支援空間大小、顯示、分配空間和佔用空間、文件數、3D工具條和分配圖、最近使用數據、文件作者、NTFS 壓縮率等資訊,同時支援搜尋文件。
搜尋的結果可以移動刪除或是匯出,該軟體類似瀏覽器界面,快速多線程,可以導入導出 Excel、HTML 或ASCII 文件。按用戶或擴展名分組搜索;保存為 XML 文檔;XML文檔對照等。你可以列印出詳細的報告,或是把收集到的資料匯出 MicrosoftExcelworkbook 或是 HTML, XML or text 文字檔。
為什麼選擇TreeSize Professional?
管理和有效清理磁盤空間
可視化磁盤空間使用情況
詳細分析,直到最低目錄級別
存檔,複製或移動 文件
眾多的出口和報告選擇
多功能重複文件搜索
安排掃描並自動執行
掃描FTP和SharePoint服務器
管理智能手機和移動設備上的磁盤空間



.jpg)
