產品目錄
產品目錄
各種平台的套裝元件
我們提供優質的軟體解決方案以節省你的預算和時間。無論是桌上型、網路版或移動裝置,MindFusion元件都將讓你的程式功能變得更加完備。
MindFusion.Suites 系列產品
MindFusion WPF Pack
Includes diagramming, charting, gauges, scheduling, spreadsheet, reporting, mapping, virtual keyboard, project management tools, UI components
MindFusion.WPF Pack為軟體工程師們提供了一整套多功能的程式設計工具。可以簡便又快速的集成入所有的WPF應用程式中,該專業化控制項可以縮短開發歷程,大幅降低開發成本以及程式設計出錯的機率。該套件結合了圖表控制項,日程控制項以及報表控制項,可以用於創建所有類型的直方圖、流程圖、報表、日曆、儀錶板、用戶介面、甘特圖等。
MindFusion WinForms Pack
Includes diagramming, charting, gauges, scheduling, reporting, mapping, virtual keyboard components
MindFusion.WinForms Pack可以讓你輕鬆又快速地添加精美的流程圖、直方圖、內容豐富的報表、智能儀錶板、行程表等元件到WinForms程式中。這個組合包中還內含6個多用途的程式設計工具,強化你的軟體功能。
MindFusion ASP.NET Pack
Includes diagramming, charting, scheduling, mapping, UI components
這套元件可以幫助你快速創建出直方圖、圖表、行程表和豐富的使用者介面。每一個控件都很容易使用也可以讓使用者自訂。
MindFusion Silverlight Pack
Includes scheduling, diagramming, reporting, charting components
MindFusion.Silverlight Pack 是一套便於集成和定制的程式設計組件。可以輕而易舉的開發出精美的圖表,日曆,表格和報表。你只需要專注於你的應用程式的邏輯,編碼和調試就交給 MindFusion來完成。
MindFusion Scheduling Pack
Includes scheduling components for WPF, WinForms, ASP.NET, Silverlight, Java, Xamarin
無論是網路或桌面上的軟體,只要是用Java, VB.NET or C#, targeting Silverlight, WinForms, Windows Phone or ASP.NET編寫出來的,你都可以使用這套軟體中的其中一個套件,創建出另人驚艷的時間表或添加一個完整的時間和工作管理工到你的程式上。
MindFusion Pack for Java Swing
Includes scheduling, diagramming, gauges, charting, spreadsheet and virtual keyboard components
體驗自由構建快速簡便的Java Swing應用程式,其具有從時間管理功能到豐富的圖表功能和時尚儀表板的各種功能集。
MindFusion Xamarin Pack
Includes diagramming, scheduling, charting components
使用MindFusion專業控件加速您的Xamarin應用程式的開發,為您提供需要數月才能開發的即用型功能。
MindFusion Diagramming Pack
Includes diagramming components for WPF, WinForms, Java, ASP.NET, ASP.NET MVC, Silverlight, JavaScript, Android, iOS, UWP, Xamarin
NetZoom Enterprise
NetZoom 是帶有內置ServiceDesk的與硬體無關的DCIM解決方案,它提供了一種整體方法來管理各種規模的數據中心的IT和設施資源。NetZoom在預算範圍內全面,可擴展,易於實施,易於調整,並且配備了合格的服務團隊來進行計劃,諮詢,培訓和實施,以確保您快速獲得投資回報。
通過實時集中管理數據中心,客戶可以通過以下方式降低成本,改善服務並提高運營效率:
主動管理數據中心
更快地配置資源
減少平均解決時間
降低能源成本
高效管理能力
減少擱淺容量
數據中心基礎架構管理+服務台
通過集成的幫助台和服務管理來管理數據中心IT和設施基礎結構。
Modeling
對設備和機架標高進行建模和配置以供重複使用。從圖到端口對整個數據中心建模。
庫存和資產管理
管理庫存,資產,所有權,資源並完成資產生命週期
庫存收集與審核
通過使用NetZoom Mobile Scanner收集實物庫存並協調NetZoom中的差異,簡化審核合規性。
電纜和連接管理
管理電源和網絡連接,包括配線架,光纖和銅纜連接,電源鍊和站點間連接。
更換管理層
輕鬆完成計劃內和計劃外的移動,添加和更改。
運營管理與生產力
NetZoom包括用於創建,標準化,度量和自動化操作流程以提高生產率的功能。
容量分析和優化
借助Analytics(分析)在每個級別上獲得洞察力。在優化功耗和空間的同時確定可能的利用率改善。
實時監控和警報管理
設置命令中心可對設施和IT(包括雲中的服務器)進行類似於NOC的監視,並通過自動升級規則有效地管理警報和警報。
商業服務管理
根據業務服務來衡量數據中心的可用性。通過監視業務服務依存關係以及確定和排除業務服務的故障點來提高業務服務的可用性。
服務台和簡化的服務台管理
為自助服務和幫助台創建並維護有效的知識庫。滿足並集中管理服務請求,事件,更改請求和問題請求。使用集成的工作流設計器實施服務工作流。
法醫日誌和風險管理
解決並滿足合規性目標,管理數據中心的物理安全性。內置應用程序維護以及維護,保修和服務合同的管理。
可視化
從辦公桌上查看數據中心。
Visio圖表
NetZoom for Visio圖表。
聯邦法規和DCOI
在預算限制和嚴格的實施時間表下,輕鬆滿足政府法規和最新的數據中心優化計劃(DCOI)。
開箱即用的集成
準備使用連接器與許多流行的應用程序集成。
擴展功能
SDK在開發人員友好的REST API集中提供了所有必需的接口。許多可隨時使用的可視化工具,例如實體管理器以擴展數據集,工作流設計器,表單構建器以定制和開發新的UI,報表構建器以創建報表,儀表板和圖表。
支持流行的瀏覽器
所有NetZoom產品均可與任何流行的瀏覽器一起使用。
Nevron .NET Vision 是一套系列產品,具有專門設計的對象模型、多種顯示特性,顯示品性更是無與匹敵,可以簡單全面的顯示複雜數據。幫助您創建傑出的Winforms及ASP.NET數據表述應用程式,帶有卓越的數據展示能力。
Nevron Vision for .NET offers the most comprehensive set of components for building enterprise-grade data visualization applications that target both the web and the desktop.
The components in this suite feature coherent 2D and 3D data visualization effects that have a great visual impact on the audience. We have also implemented a large set of data visualization techniques and innovations to maximize the clarity of the visualized data and to make it more comprehensive for the viewer.
The components are built upon a common framework, thus minimizing the learning curve needed to get started with them as a whole. The common framework also ensures consistent features, performance, polished API and other benefits that are a product of over a decade of refinement.
Nevron Chart for .NET
Nevron Chart for .NET
Nevron Gauge for .NET
Nevron Diagram for .NET
Nevron Map for .NET
Nevron User Interface for .NET
GoJS for HTML5/Canvas 是一套 JavaScript函式庫,用於繪製網頁精美的互動式圖表。可繪製多種互動式圖表,包括:Flowchart、state chart diagram、organizational chart diagram、Gantt chart 等。
Fully Interactive Diagrams
Extensible Layouts and Tool System
Data-Binding and Models
Transactional State and Undo-Management
Mobile Support
Supports Major Frameworks e.g. React, Angular
Data Binding & Templates
GoJS supports graphical templates and data-binding of object properties to model data. Only the model, consisting of simple JavaScript objects, needs to be saved and restored. GoJS makes it easy to read and write models in JSON format.
Thorough Documentation
We provide comprehensive API documentation and in-depth overviews of GoJS concepts, with interactive examples. With over 90 samples, you'll find numerous examples of GoJS properties and methods.
Lightning Fast Diagramming in the Browser
GoJS takes advantage of the HTML Canvas to support high-performance diagrams. For creating static documents and printable resources, GoJS supports exporting Diagrams to images and SVG.
What is ORA_EXCEL?
ORA_EXCEL (Oracle Excel) is PL/SQL package for Oracle® database that produces Excel XLSX documents. ORA_ EXCEL 讓開發人員能夠去建立Excel報表或利用簡單的PL / SQL API方式從oracal數據庫導出excel文件。
QCSPCChart
QCSPCChart SPC控制圖工具軟體是一個面向對像的工具,針對那些想添加靜態和動態品質控制圖和Web應用程序開發人員的工作站。典型用戶程式控制工程師和品質控制人員創建將用於監測生產過程的關鍵質量因素,應用和服務行業。工具箱包括最常見的SPC控制圖類型範本:variable control charts (X-Bar R, X-Bar Sigma, Individual Range, Median Range, EWMA, MA, MAMR, MAMS and CuSum charts), attribute control charts (p-, np-, c-, u-, and DPMO charts), frequency histograms, probability charts and Pareto diagrams. The software will automatically calculate SPC control limits using historical data for the supported variable control chart and attribute control chart types. Alarms can be generated for standard +3 sigma control limits, or standard SPC rule sets (WECO, Nelson, Juran, Hughes, Gitlow, AAIG, Westgard and Duncan). It will also calculate process capability ratios (Cp, Cpl, Cpu, Cpk and Cpm) and process performance indices (Pp, Ppl, Ppu and Ppk). Versions available for .Net (VB and C#), WPF (VB and C#), Java, and JavaScript.
QCChart2D Charting Tools for .Net
此軟體專為Net的圖表工具包,系統以C#編寫,是對於任何想添加複雜的交互式圖表圖形到Net的應用程式使用者的好幫手。此工具包支援用於工程和科學終端用戶線性,對數,極和天線坐標系等。
Real-Time Graphics Tools for .Net
此軟體同樣以C#,是專給對於想添加實時圖形到Windows、.Net和ASP.NET Web應用程序的開發人員。
SPC Control Chart Tools for .Net
是專給對於任何想把靜態和動態質量控制圖添加到C#和Visual Basic的應用程序開發人員。
QuickReport 是用於C++ Builder和Delphi的一款報表元件,可以簡單快速的輸出數據庫報表。
QuickReport 支援創建列印預覽以免浪費紙張,支援導出數據為其它文件格式如ASCII文本、逗號分割值的文件和HTML。
QuickReport 本身由 Delphi 編寫,支援Delphi 所有操作數據庫的模式。因此您可以將它用於舊式的基於BDE 的數據庫如Paradox 和 dBase,用於多層應用環境的用戶端數據表,新的Delphi 5 ADO 和 Interbase Express 元件及第三方可選數據庫如Apollo。
如果您需要,甚至可以用QuickReport 格式化部件列印非不是存儲在數據庫裡的數據。
各控件介紹
TQuickRep
A container for all the other printing components.
TQRAbstractReport
QuickRep without any of the database code and dependencies.
TQRSubDetail
This is the detail band in a master/detail relationship.
TQRLoopBand
The loopband will print as many times as indicated by its LoopCount property.
TQR String Band
This is the detail band in a master/detail relationship.
TQRShape
A cousin of the little-used TShape control from Delphi’s ‘Additional’ palette.
TQRBand
A generic band type.
TQRChildBand
Use TQRChildBand objects when you need to extend an existing band.
TQRGroup
A band that prints whenever an expression changes, usually a database field.
TQRLabel
Place some static text on the page..
TQRDBText
Display the contents of a linked database field
TQRExpr
Use this to display the result of an arithmetic expression.
TQRSysData
Displays ‘system data’, like the current page number, date, time.
TQRMemo
Use this to display multiple lines of text.
TQRExprMemo
A composite of TQRExpr and TQRMemo.
TQRRichText
This is similar to the TQRLabel but will display formated rich text.
TQRDBRichText
As you’d expect, this is a data-aware version of TQRRichText.
TQRImage
Display a picture or logo on a report using this control.
TQRDBImage
Displaying images stored in BLOBs.
TQRPreview
Allows the creation of a customizable runtime report preview.
TQRCompositeReport
Allows many reports to be combined into a single document.
TQRCSVFilter
Enables reports to be exported to comma-separated (CSV) text files.
TQRGrImage
Control the aspect ratio of the printed image.
TQRGrDBImage
Control the aspect ratio of the printed image.
TQRAbstractTable
Retrieve data from any source(s) to drive a report.
TQRTextFilter
Export reports to ASCII text files....
原生於Silverlight的Gantt控件,它具有功能豐富,靈活可定制,高性能等特性。
*Project Gantt可用於視化分層任務列表。
*Resource Gantt可實現資源利用率的顯視圖。
*虛擬化輸出使您一次就能顯示千條以上的記錄。
*適用於所有類型的項目:建設、軟體開發、航空日程表、合規審核、新產品的投放市場、新商務專案、客戶服務等
直觀的交互式編輯:
Rich set of built-in editing functionalities provide you a rich and functional UI.
可擴展可視化:
Use a set of built-in visualization options like Resource Load View, Critical Paths or customize the look to visualize tasks and regions of interest.
內置日程安排功能:
A rich Gantt Model sits between your data and the gantt and provides custom scheduling capabilities, resource assignment and resource leveling capabilities.
EdgeDoc ASP.NET Document Viewer
在線查看,評論,轉換,編輯PDF,Word,Excel,PowerPoint,Tiff和其他100多種文件格式。
Supported Files
Microsoft Office Word: DOC, DOCX, DOCM, DOT, DOTX, DOTM
Microsoft Excel: XLS, XLSX, XLSM, XML
Microsoft PowerPoint: PPT, PPTX, PPS, PPSX
Adobe PDF: Portable Document Format
TIFF: Tagged Image File Format
DICOM: Digital Imaging and Communications in Medicine
Text File: TXT, NotePad
Raster Image Files: BMP, GIF, JPG, PNG, JBIG2PDF Conversion
View, Zoom & Rotate
RasterEdge .NET Document Image Web Viewer enables you to easily load and view web document at fast speed with the help of thumbnail, page navigate button, and outline.
XDoc.HTML5 Viewer for .NET empowers you to use three ways to load document or image to view in web viewer, including through URL to open specified file in server file system or on another web site (this can also be achieved through clicking "Open an online document" button), and by clicking upload button to open local document.
In addition, you can directly control web image or document viewing effect by setting width and height of the viewer, using zoom in or zoom out functions, and changing file rotation angle (clockwise 90 degrees). Certainly, display format is user-defined as well. You may convert supportive documents and image format files into Bitmap, as well as SVG files at the same time. In this case, you can determine to display target document or image as SVG or Bitmap.
Page Navigation
First one is through thumbnail image. A thumbnail image is generated for each page in loaded file. By clicking a thumbnail, you are redirect to a corresponding page.
The second way to navigate through web document is by outlines. Most of the well-formed documents contain outline information. For Word document, an automatic document outline is generated for navigation purpose. For documents like PDF, outline information is extracted from document if it is included.
Last way to navigate through the document is by search result. If you want to search the document content, you can use corresponding APIs provided.
Content Search
Our XDoc.HTML5 Viewer for .NET allows .NET developers to search text-based documents, like PDF, Microsoft Office Word, Excel, and PowerPoint (2003 and 2007 versions). The well built-in text search tool is compatible with most modern web browsers.
You may have a quick search in the viewed document and find what you need. Flexible search methods are offered, like searching content via ignore case and whole word methods. To help users quickly locate what you are looking for, all results will be highlighted with specific color.
Annotate
RasterEdge .NET document and image viewer allows users to add various annotations on viewing file, such as text, freehand, line(s), highlight, ellipse, rectangle, rubber stamp, polygon, arrow and so on. By creating, loading, and modifying annot...
ReportBuilderg實際上是標準的Delphi報表解決方案。Delphi開發人員一致認為ReportBuilder產品為年度最佳報表工具(1999年- 2003年)。ReportBuilder提供傳送產品製作報表的需求,完成Windows 應用程序Delphi的編程。本著這樣的精神,ReportBuilder提供了RAD環境和一個以對象為目標的平台,做為解決報表的程式。
更新介紹
New features
Support for Delphi 12.x
new Docx (Word) Device
new PDF Device, Digital Signature features
new PDF Device, Native font processing
new PDF Device ZUGFeRD attachment streaming
new QRCode EPC support
new DataMatrix GS1 support
new PDFComponent load from DataPipeline, File, Stream
new PDFComponent PrintBehaviors: Section, Fixed
new PDFComponent, Page Layer support
new Web/Cloud Services, Credential saving
new Web/Cloud Services, Refresh Token support
new Outlook Email plug-in features
new EMail features
new Cloudrive features
SDL Component Suite是業界中領先的支援科學和工程計算的控件集合,整個套裝軟體包括約50個Units,其涵蓋了在科學和工程的廣泛要求。其可用於Delphi和C + + BUILDER。如擁有10萬行源碼、50個常式、3D資料、地圖集、原子符號、β函數的情節的旋轉、校驗掃描的圖像、化學資料、化學公式、X分配、群聚、轉換程式、地理資料、基體、圖解、目錄、配給、矩陣標籤等等,有相當多的控制項資源。
SDL Component Suit包含六個軟體包:BasePack、MathPack、ChemPack、GuiPack、GeoPack、Chartpack,其涵蓋各種主題的科學和工程。而這些軟件包可以根據自己的需要去選擇,另外如您有購買的ChemPack、GuiPack、GeoPack、Chartpack的話,BasePack和MathPack則是免費包含在內,以下介紹六個軟體包:
BasePack
BasePack包含SDL Component Suite中“基本操作和數據結構”的單元,其中包括FIFO寄存器、位陣列、系統的具體例程、串流處理、字符串處理等。
注意:BasePack是SDL Component Suite的基礎。因此,您必須安裝BasePack才能安裝其他的套包。
MathPack
MathPack包含大量的例程與分類給各種數學方法,包括線性回歸(簡單和多元)、曲線擬合、隨機發生器、向量和矩陣代數、向量、主成分、聚類分析、傅立葉變換、Kohonen網絡、統計分佈及更多。
注意:在MathPack安裝前必須要先安裝BasePack。
ChemPack
ChemPack提供各種例程與分類給化學和化學結構,其提供基本數據及例程,讓其能夠與分子結構式運行。此外,也包含可顯示化學結構。
注意:在ChemPack安裝前必須要先安裝BasePack和MathPack。
GuiPack
GuiPack提供廣泛的圖形界面的組件,包含顏色選擇框、顏色漸變組件、VU表、輸入和輸出元素、多用途的進度條、滾動點陣顯示、快速的字符串數組及標籤顯示就像Web鏈接一樣。
注意:在GuiPack安裝前必須要先安裝BasePack和MathPack。
GeoPack
GeoPack包含三個組成單元,分別可以支援地理地圖和地理數據。
注意:在GeoPack安裝前必須要先安裝BasePack和MathPack。
Chartpack
ChartPack提供許多科學與技術圖表的組件,包括三維數據圖(3D data plots)和三維表面圖(3D surfaces)等幾個圖表組件。
注意:在ChartPack安裝前必須要先安裝BasePack和MathPack。
另外請注意SDL Component Suite軟體包的基本需求
SDL的組件套件都需要BasePack,以下是這些依賴關係的列表:
Package
Depends on
BasePack
none
MathPack
BasePack
ChemPack
BasePack, MathPack
GuiPack
BasePack, MathPack
GeoPack
BasePack, MathPack
Chartpack
BasePack, MathPack
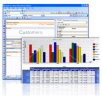
Report Sharp-Shooter 旨在創建功能豐富、靈活的BI應用,可以解決即使是最複雜的報告和分析任務。特色在於設計器生成報告或使用嚮導的能力,輸出製成的報告於各種格式,包括PDF、HTML、EMF、BMP、JPG、GIF、TIFF、PNG、Excel、,Excel(XML)、CSV、TXT和RTF格式。
除此之外,Report Sharp-Shooter包含以下功能:
報表設計
創建任何複雜的報告(交叉標籤,參數化,分報告,SideBySide報告等);
修改最後報告的最終用戶使用設計
報告佈局所產生的一套工具,Report Sharp-Shooter™可為重覆使用的模板
使用數據源
使用任何支持你的申請的 .NET數據源
創建綁定和未綁定的報告
可視化
在該報告相容下,創建數據透視表的基礎上的任何數據來源
設計圖的可視化數據的代表性
支持條形碼,圖片和形狀。
報告預覽
WinForms控件查看器
一個ASP.NET WebForms查看器
Report Sharp-Shooter™是專為 .NET框架,寫在C#中,並包含只有100%的管理和安全的代碼。
專業版本的產品帶有完整的源代碼。運行時的Report Sharp-Shooter™是免版稅。
相容 .NET Framework 1.1 和 .NET Framework 2.0
請注意,Report Sharp-Shooter 3.8 僅支持 .NET 2.0。如果你用 .NET Framework 1.1,請使用 Report Sharp-Shooter 2.3,它同時相容 .NET 1.1 和 .Net 2.0。
與大多數流行 .NET IDE 相容。
Report Sharp-Shooter™ 可用於 Visual Studio.NET,Borland C# Builder,Delphi.NET,Sharp Develop 和其他 .NET IDE。而且,Report Sharp-Shooter™ 不需要任何 IDE 就可運行。最低要求是最終用戶的機器安裝有 .NET Framework。
支持 WinForms 和 ASP.NET WebForms
Report Sharp-Shooter™ 可以用於 WinForms 和 ASP.NET WebForms 程式。鑒於 ReportViewer 和 SharpShooterWebViewer 控制項包含在 Report Sharp-Shooter™ 之內,用戶可以在 WinForms 和 WebForms 程式內查看報告。
可管理報告引擎。
產品由 C# 編寫,僅包含管理代碼。
基於 XML 的報告文件格式易於在 Internet 上共用
可以保存報告為 XML 格式,使其能夠線上共用。
開放式插件架構。
Report Sharp-Shooter™ 具有開放式插件架構,意味著你可以容易地通過添加自己的 DLL 作為插件來增加功能。例如,你可以創建自己需要的導出篩檢程式,並在 Report Sharp-Shooter™ 中使用它。
使用 GDI+ 的好處:漸變填充、alpha 混合、自定義形狀等等。
Report Sharp-Shooter™ 可以使用所有 GDI+ 的優勢來繪製報告元素,這使你的程式看起來專業和高端。
容易添加個性化語言。
你可以輕易地翻譯 Report Sharp-Shooter™ 介面為母語並作為 XLM 檔添加它到 Report Sharp-Shooter™ 中。
有詳細文檔和廣泛的使用例子。 運行時免版稅。
Report Sharp-Shooter™ 是運行時免版稅。這意味著你可以發佈包含 Report Sharp-Shooter™ 的程式給最終用戶,不需額外費用。
可獲得完整源代碼。








.jpg)
