最新版 amCharts v5.10.5 更新於 2024/9/6
amCharts 提供您最需要的JavaScript/HTML5圖表。amCharts 是用Flash開發的基於Web的圖表軟體產品,amCharts 支援CSV和XML資料類型,同時也支援動態產生的資料,例如PHP, .NET, Java, Ruby on Rails, Perl, ColdFusion等更多的程序語言。因為amCharts是基於flash開發的產品,所以具備了和使用者交互的功能,可以在頁面中隨意改變要顯示的資料。
| X/Y Line & Smoothed line Area & Range Area Column & Bar (stacked or clustered) Scatter & Bubble Candlestick & OHLC Step (incl. w/ no-riser) Floating & Gantt Waterfall Error & Control Stacked (regular or 100%) Heatmap Pareto Diagram Bullet Dumbbell Plot & Lollipop Order Book / Depth Stream & Process Control Beeswarm Box Plot Mekko Micro & Sparklines … and any combination of the above |
Percent Pie & Donut Nested donut Funnel Pyramid Pictorial |
Other Sankey diagram Chord, Chord directed, and Chord non-ribbon diagrams Pack Treemap Voronoi Tree Arc Sunburst Partition Force-directed tree Radar & Polar Gauge Radial Histogram & Heat Map Flower & Wheel of Life Word cloud & Sentence cloud Venn diagram Infographic |
|
| Geo maps Map chart (flat & globe) Geo heat map Tile map Map combined with charts Maps is an add-on and requires separate license. |
| 最先進的圖表包 | ||||
 |
 |
 |
||
|
經典與一些新的曲折 |
新的地理地圖 此外,地圖現在非常靈活, |
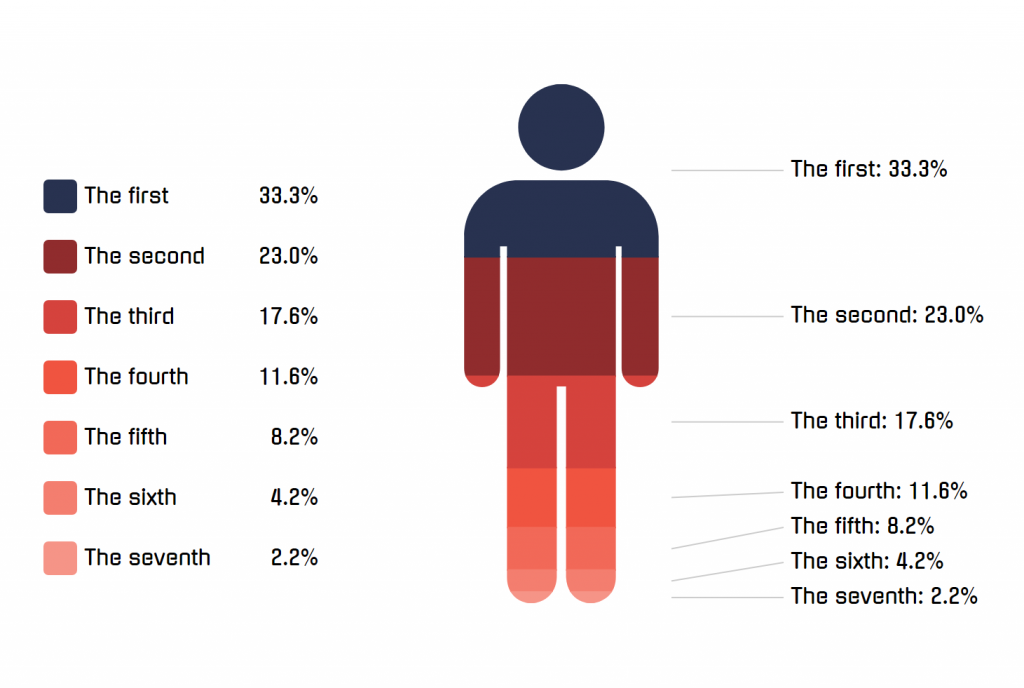
畫報 |
||
 |
 |
 |
||
|
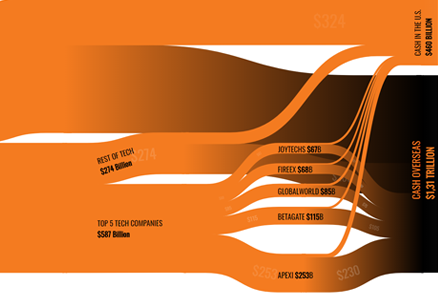
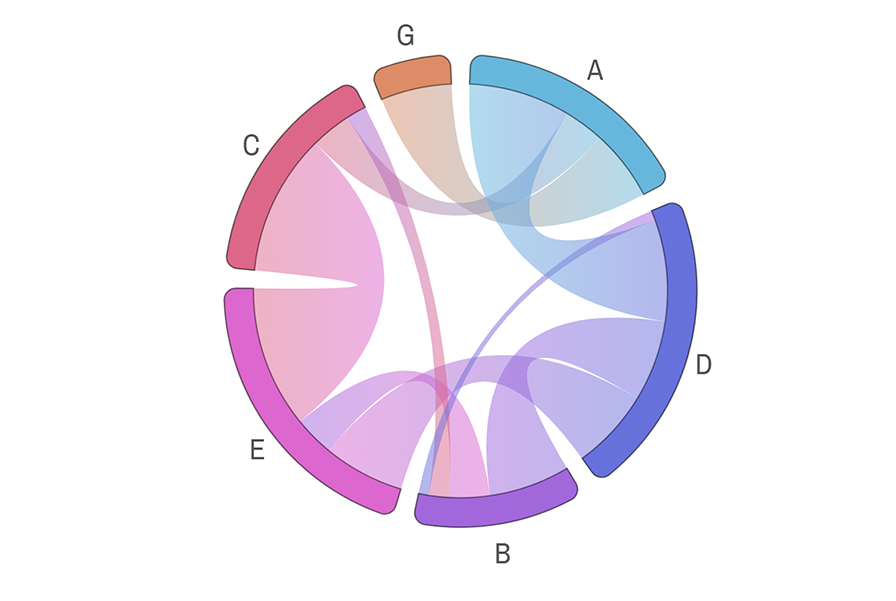
Sankey Diagrams |
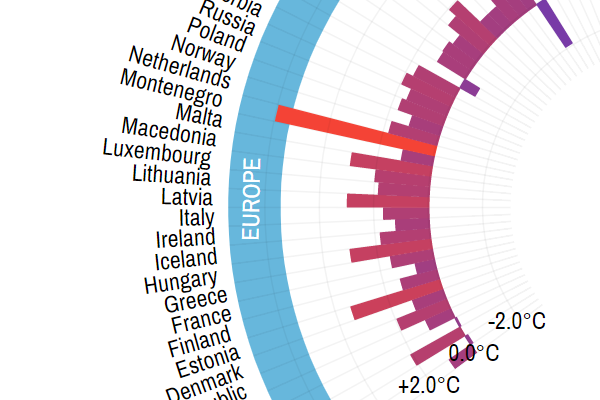
增強雷達圖表 |
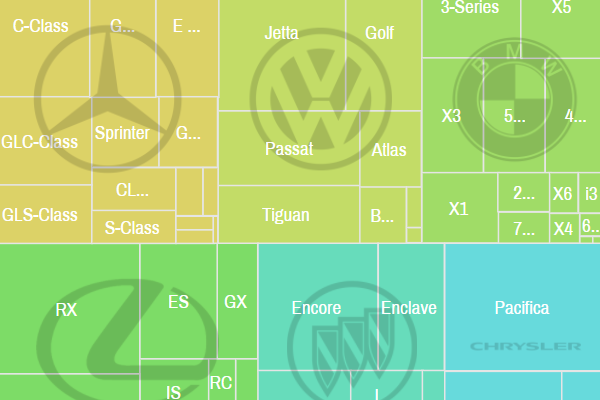
樹狀圖 |
||
 |
 |
 |
||
|
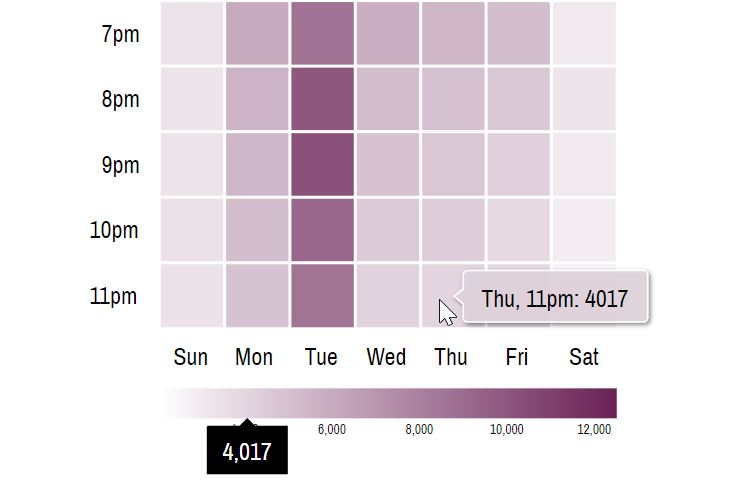
比賽地圖 使用顏色或點大小或兩者創建熱圖。 通用且靈活的加熱規則允許將數據中的任何值附加到任何元素上的任何屬性或屬性。 |
和弦圖 內置的節點切換功能允許用戶專注於重要的關係。 |
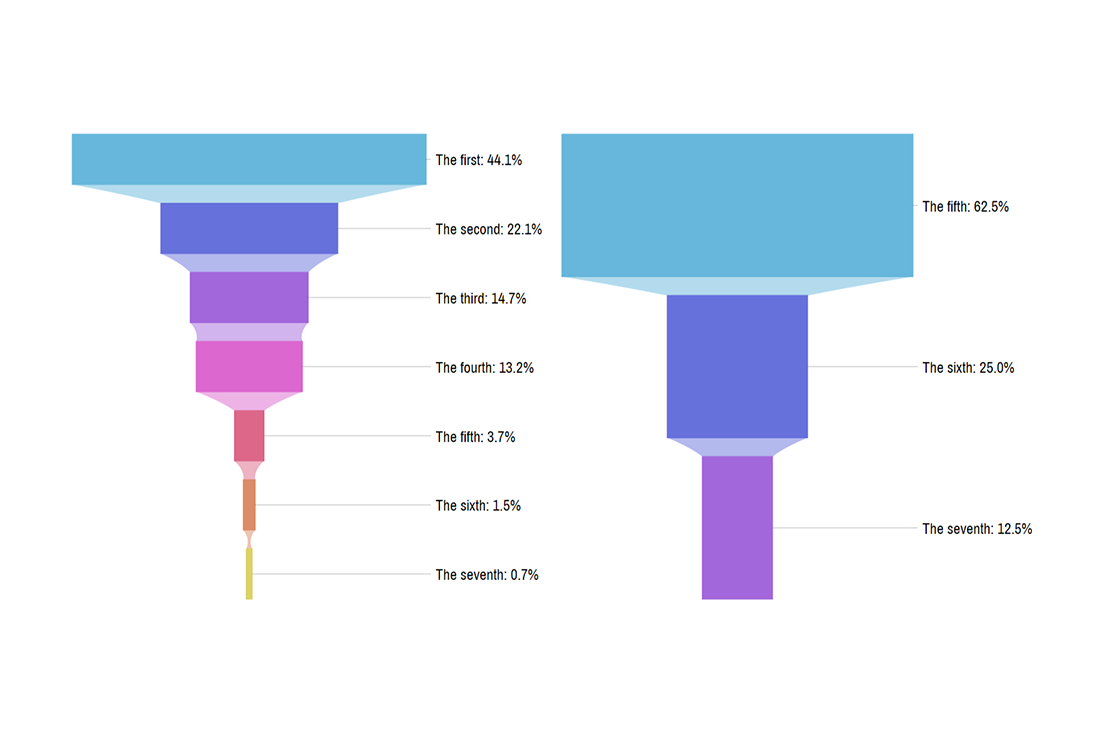
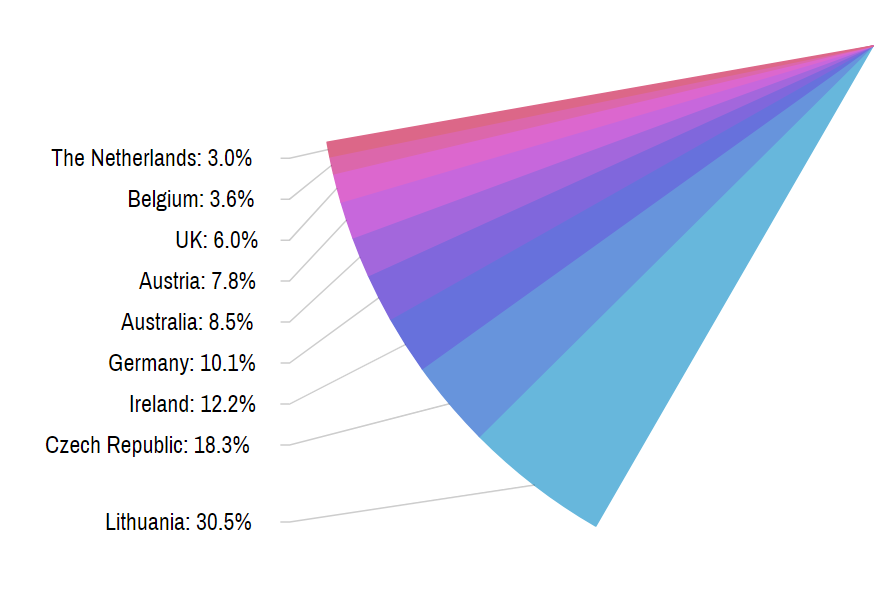
真正的漏斗圖 切片的面積大小代表值,因此每個步驟對總體積減少的影響比基本漏斗更突出。 梯形形式也可以配置為進一步強調減少。 使用其他可視元素完成它,例如完全可配置的切片線,多個系列支持,可切換的圖例以及許多其他選項。 |
||
| 靈活性 | ||||
 |
 |
 |
||
|
什麼都可以 想要將另一個圖表添加到列中嗎?沒問題。 添加三個SVG圖像和一個標籤作為線系列的項目符號?當然,為什麼不呢。 |
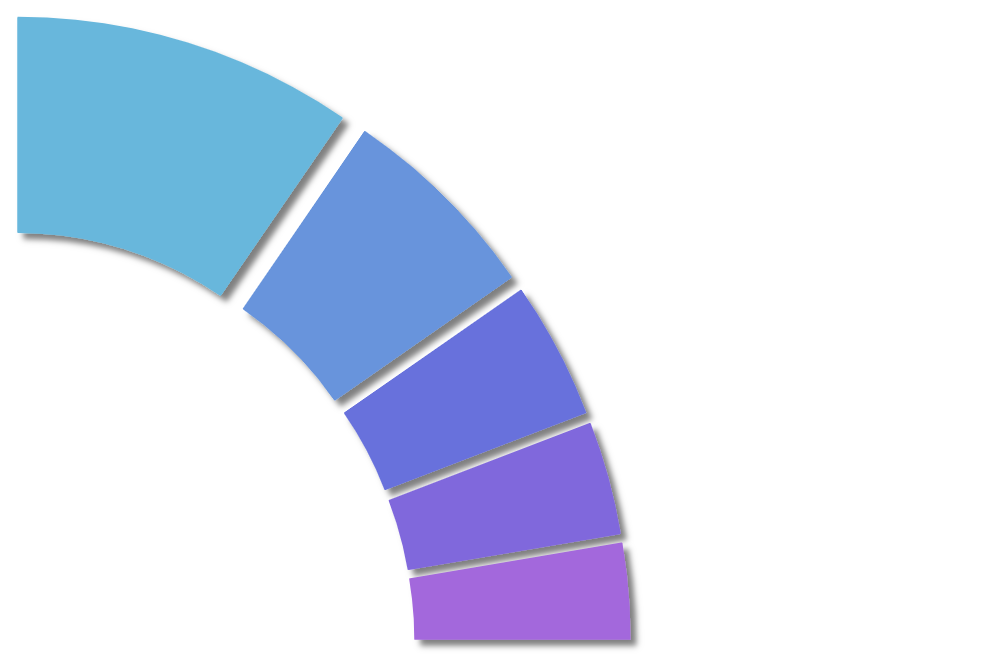
一切都是可配置的 角度,顏色,位置,半徑,任何東西都可以設置為完全按照您需要的方式彎曲經典和新圖表類型。 |
元素狀態 引擎將根據需要自動應用所需的屬性,平滑地在舊值和新值之間設置動畫。 通過API創建和應用自定義狀態。 |
||
 |
 |
 |
||
|
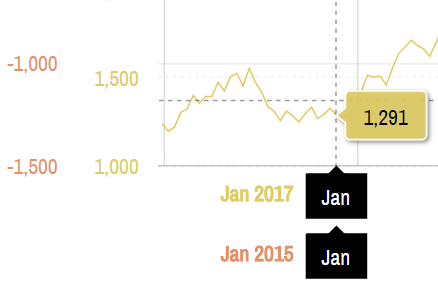
多種類型的多軸支持 創建不同時間尺度的重疊比較。 使用任何尺寸值組合:數字,日期,類別或持續時間。 |
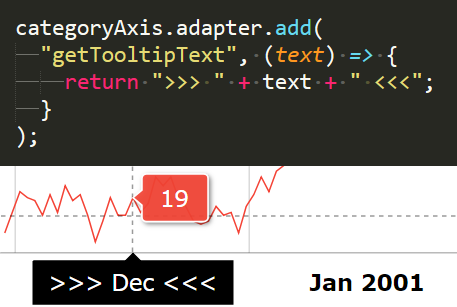
適配器 |
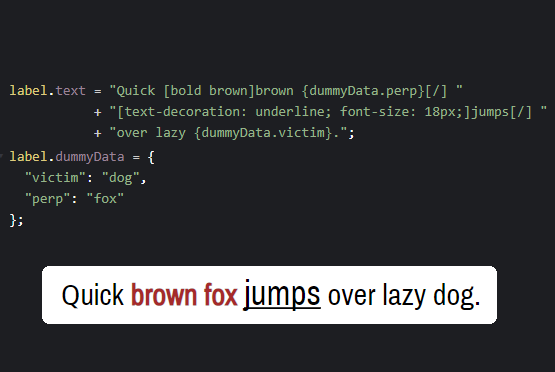
文字格式 感覺更勇敢?現在,任何標籤都可以接受完整的HTML,包括CSS,圖像以及您可以在瀏覽器中輸入的任何內容。 除格式化支持外,標籤現在還可以包含實際數據的內嵌佔位符,並能夠將自定義格式應用於值。 |
||
| 績效與數據管理 | ||||
|
針對大型數據集進行了優化,開箱即用 結果 - 快速圖表將顯示數千個數據點而不會出現打嗝。 |
SVG針對性能進行了優化 即使圖表上有許多複雜的元素,這也會產生出色的性能。
|
增量數據更新 內置支持外部數據源,包括重複加載和增量數據。 |
||
| 視覺上令人驚嘆 | ||||
|
新的外觀 專門選擇精心挑選的配色方案和默認設置,使圖表脫穎而出。 |
流暢的動畫 沒有波濤洶湧的步進動畫 - 一切都很流暢,包括變焦和切換系列和其他項目。 內置變形機制,可以變形和改變形狀。 |
多主題支持 此外,每個圖表可以應用多個主題,這允許組合來自多個源的通用特徵,即材料顏色+動畫主題。 |
||
 |
 |
 |
||
|
專注於色彩 它也很容易自動生成互補色。例如,圖表將自動選擇在工具提示的彩色背景中突出的對比色。 內置顏色集功能提供了基於許多可配置參數自動生成對比色的方法。只需設置一些初始顏色,然後觀察圖表自動生成彩色托盤。 |
梯度和模式管理 選擇引人注目的默認設置或提供自己的步驟,顏色,方向以及其他任何內容,以獲得獨特的外觀和感覺。 如果漸變不是你的一杯茶,任何圖像都可用於為任何元素創建圖案填充。 |
內置SVG過濾器 想讓你的專欄投下陰影嗎?只需在列系列模板中添加“投影”過濾器即可。 此外,過濾器也可以應用於狀態。該圖表將在兩個設置之間自動設置動畫。 捆綁過濾器包括:投影,去飽和,模糊,著色,聚焦,變亮。 |
| 可訪問性和交互性 | ||||
 |
 |
 |
||
|
無障礙 |
互動 |
觸摸支持 |
||
| 可訪問性和交互性 | ||||
 |
 |
 |
||
|
使用TypeScript構建 完全支持TypeScript和ES6模塊。 |
JavaScript的100% amCharts 4不使用或依賴全局變量,外部框架或第三方庫。 支持雙配置:基於對像或通過序列化JSON。 |
通用SVG引擎 通過幾行代碼將各種元素添加到屏幕,使它們具有交互性。使用內置的交互功能,使它們可拖動,可調整大小,可旋轉,可轉換。 通用SVG佈局引擎將根據設置規則放置,調整大小和排列元素。 滑鼠,觸摸和鍵盤事件可以附加到DOM樹中的任何對象。 |
||
授權比較
| Basic license Use in public websites, where users don't need to log in. |
SaaS license Use in SaaS (Software as a Service) websites, where user logins are required for access. |
OEM Use in redistributable mobile, desktop, or web apps. |
Extended OEM Extend your OEM license to affiliates and 3rd party / whitelabel OEM products. |
|
| Usage limits | ||||
| Users | Unlimited | Unlimited | Unlimited | Unlimited |
| Pages / Instances | Unlimited | Unlimited | Unlimited | Unlimited |
| Public websites (Do not require user login) |
Unlimited | Unlimited | Unlimited | Unlimited |
| SaaS websites (Requires user login to access) |
- | Unlimited | Unlimited | Unlimited |
| Redistributable Mobile, Desktop, or Web (SaaS) applications (SaaS - Software as a Service) |
- | - | Unlimited | Unlimited |
| Physical servers | Unlimited | Unlimited | Unlimited | Unlimited |
| Development, testing or staging servers / environments | Unlimited | Unlimited | Unlimited | Unlimited |
| Subdomains | Unlimited | Unlimited | Unlimited | Unlimited |
| Individual developers working with the library | 1 | 1 | 1 | 1 |
| Support & Upgrades | ||||
| Months of amPlus subscription included with purchase | - | 12 | 12 | 12 |
| Access to amCharts support staff | Available to purchase | Yes | Yes | Yes |
| Included support hours | - | 12 (per seat) | 30 (per seat) | 90 (per seat) |
| Free minor version upgrades (e.g.: V5.1 > V5.2) |
Yes | Yes | Yes | Yes |
| Free major version upgrades (e.g.: V5 > V6) |
While subscription is active. | |||
| Includes previous versions (V4, V3) | Yes | Yes | Yes | Yes |
| Other | ||||
| Removable amCharts branding | Yes | Yes | Yes | Yes |
| Includes source code | Yes | Yes | Yes | Yes |
| Upgradable to other license type | Yes | Yes | Yes | Yes |
| Extended Usage | ||||
| Use in software development tools | No | No | No | Yes |
| Can be used by purchaser and its affiliates | No | No | No | Yes |
| Use in 3rd party rebranded software | No | No | No | Yes |