面對競爭日益激烈的市場,如何以最短的時間,發現最重要的影響因子,加速新產品的開發來改善製程的發展,以及保持產品的品質..等等,這些都是研發部門的關鍵課題。如果您不是實驗設計專家,但您的研究有需要用到實驗設計,或是您想要買一套實驗設計軟體,而且常用的實驗設計功能都需要含在軟體內,那Design-Expert應該就是您要的產品了!Design-Expert 是目前使用最廣的實驗設計軟體(design of experiments,DOE),非常容易使用,其包含許多強大的實驗設計功能。
其中 Response surface methods (RSM) 提供3維圖形觀察,可大幅減少試誤的成本,並找出品質的關鍵;互動式的2D圖形可讓您觀察等高線圖,並可以預測其特性,其亦可產出3D圖形,可以讓您觀察反應的曲面,用以求得最佳化值,您也可以即時的旋轉任何角度並觀察其變化。而圖形最佳化功能,可以清楚的顯示多重反應的最佳值。
Design-Expert 擁有混合式設計(Mixture Design)功能,可讓您可以用最短的時間發現最佳化的公式。面對競爭日益激烈的市場,如何加速新產品的開發、如何加速製程的發展、如何改善產品的品質、如何避免技術人員經驗的斷層、如何得到最佳生產條件、如何簡化複雜的非線性系統等等的問題,Design Expert將會是您唯一的解決方案,提供各種最完整的實驗設計方法,可以自動找出重要影響因子,並滿足各項最完整的實驗設計功能!

新版更新
New in 22.0: Analysis Summary
The new Analysis Summary expands the previous Coefficients Table with more model-fit statistics. Easily view p-values, R-squares, model equations and more, across all responses.
Available Now: Hosted Network Licensing
A new licensing option is available to host a network license at statease.com. This allows you to run the software on multiple devices without requiring an on-premises license server, thus reducing costs for DIY software deployment and management.
New in 22.0: Custom Graphs
The Graph Columns node has been upgraded to Custom Graphs. You can now plot analysis data like predicted values and residuals –plus distinguish points by size and symbol.
| Logistic Regression for Binary Responses | Kowalski-Cornell-Vining (KCV) models | |
 |
 |
|
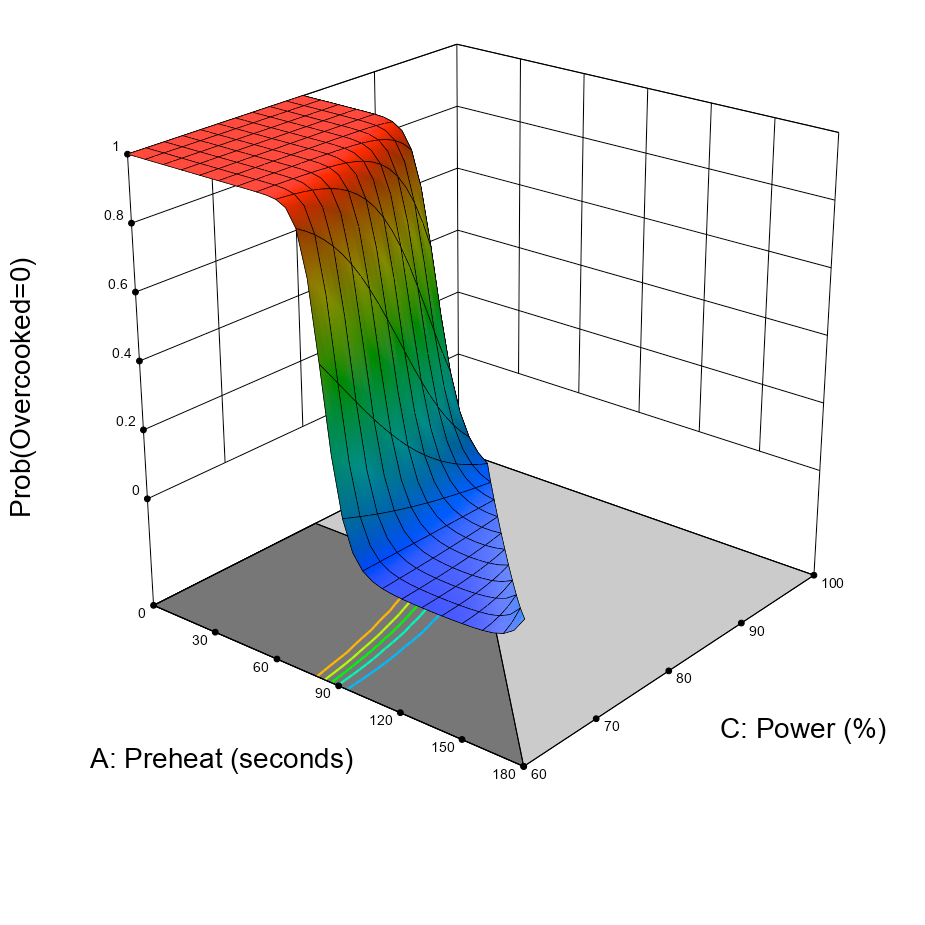
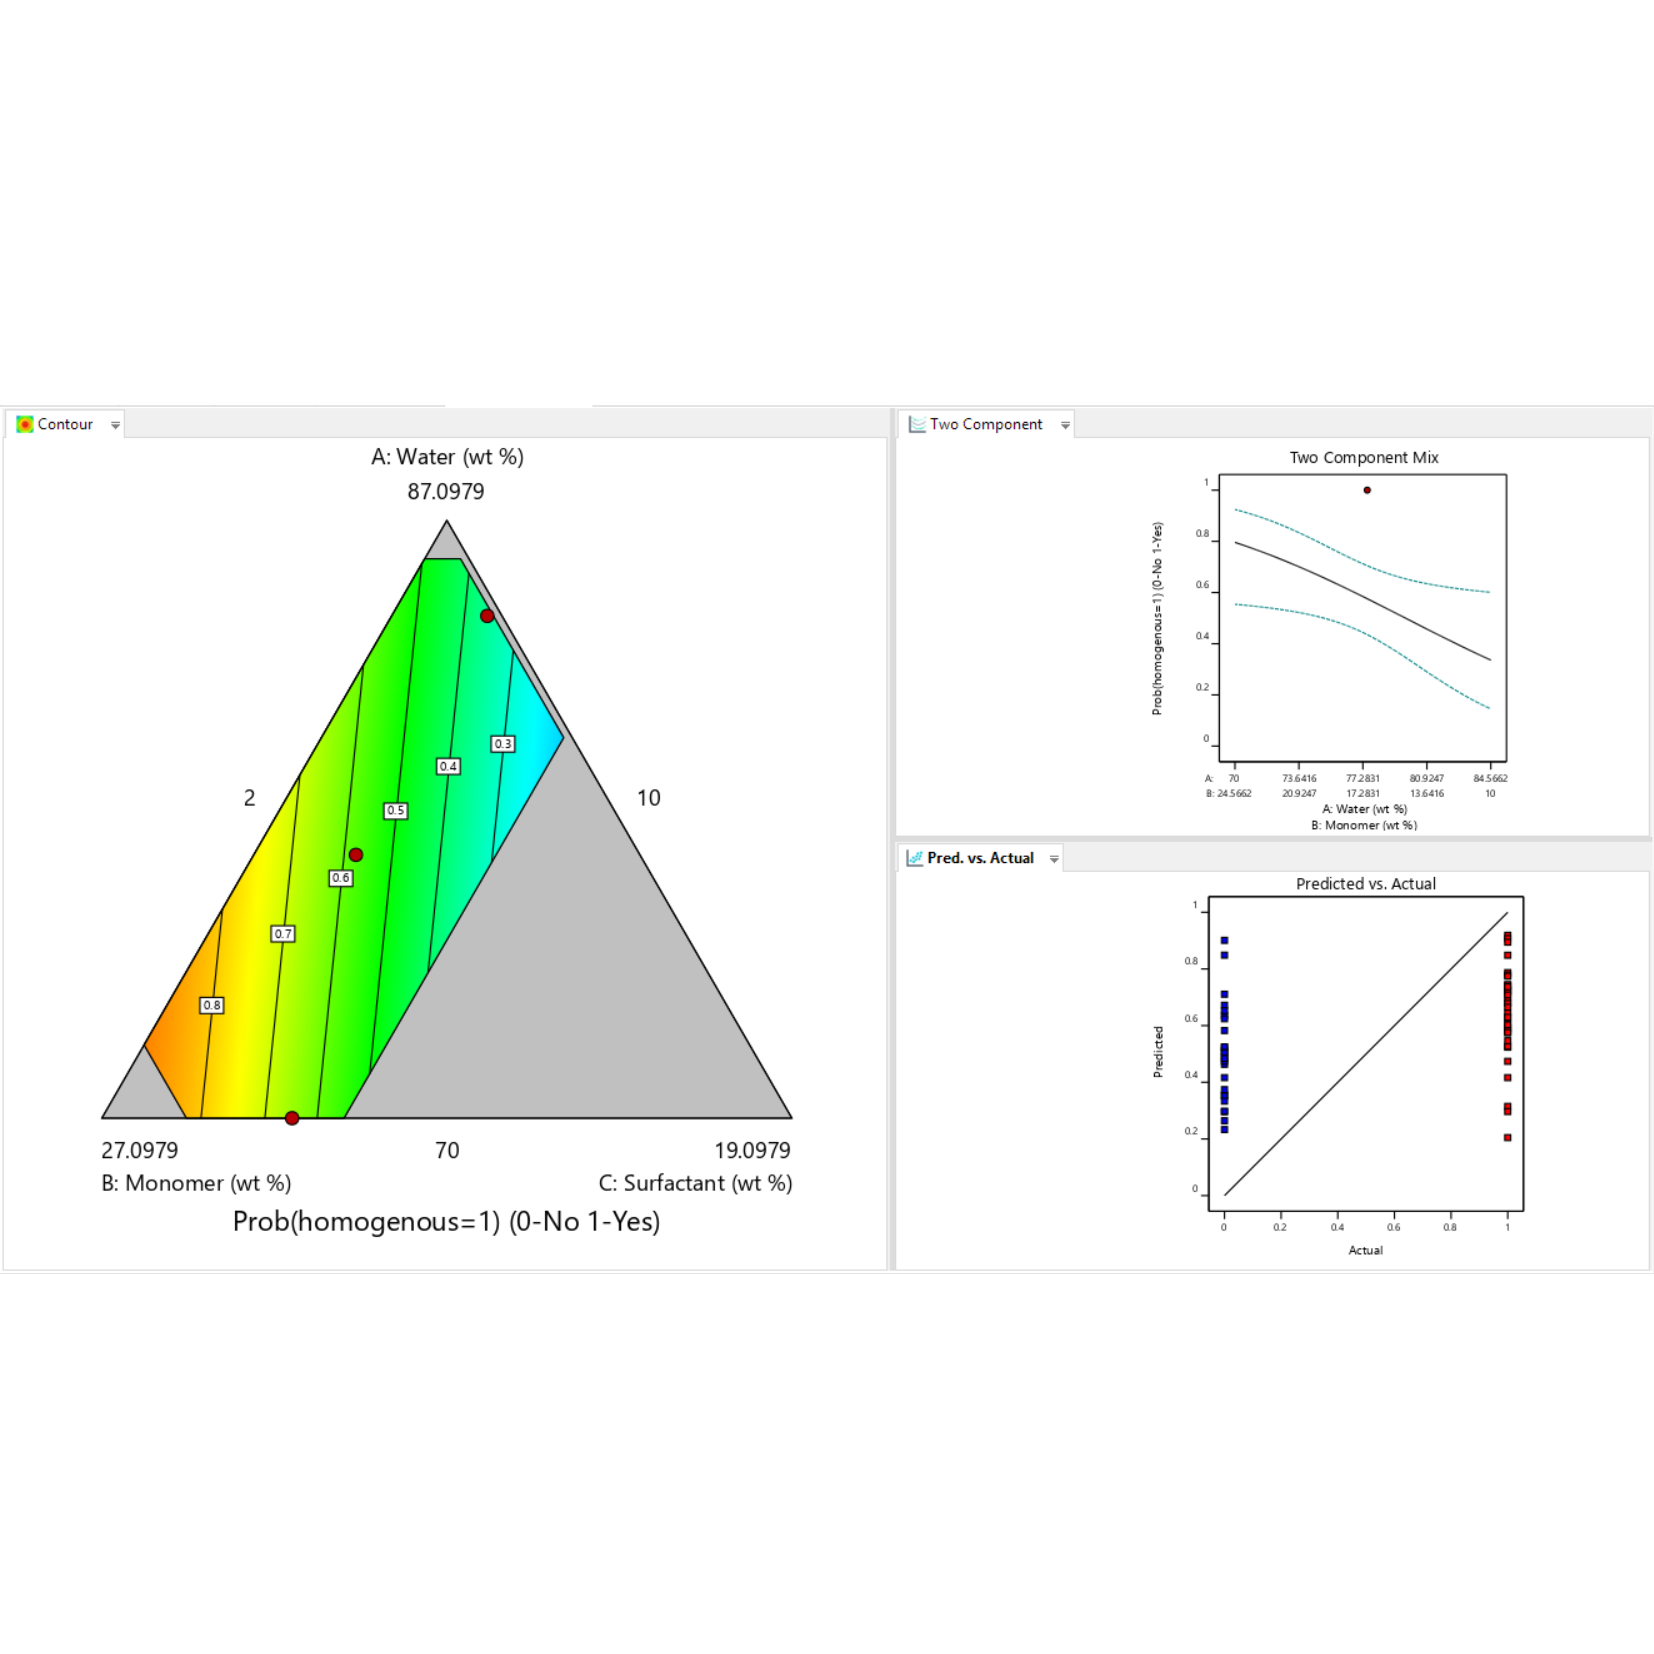
| When results can only be binomial, for example; 0 or 1 for pass versus fail, standard model-fitting falls short. Logistic regression works far better by predicting the probability of success or failure, as shown in the plot of a surface-to-air (SAM) missile test. “The development work that we do at my company often requires 0/1 assessments. This will be a tremendous help for us.” – Jason Pandolfo, Development Chemist, Quaker Chemical |
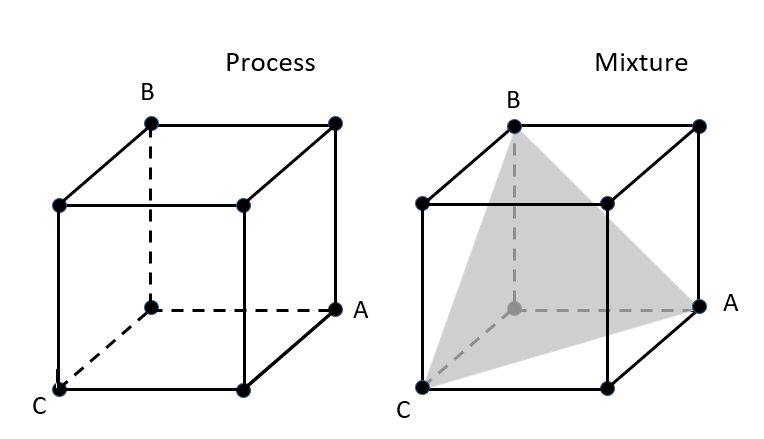
Experiments that combine mixture components (such as a cake recipe) with process factors (baking conditions, for example) require too many combinations when fitted to traditional crossed (mixture x process) models. By eliminating superfluous high-order terms, KCV models greatly reduce the number of required runs, with appreciable savings in time, materials and money. | |
| 3D Scatterplot | Histogram Plot | |
 |
 |
|
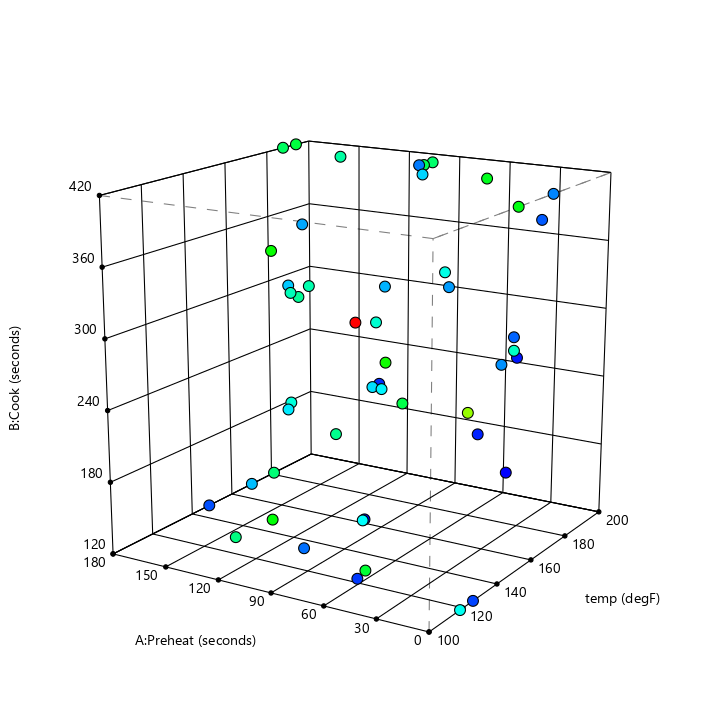
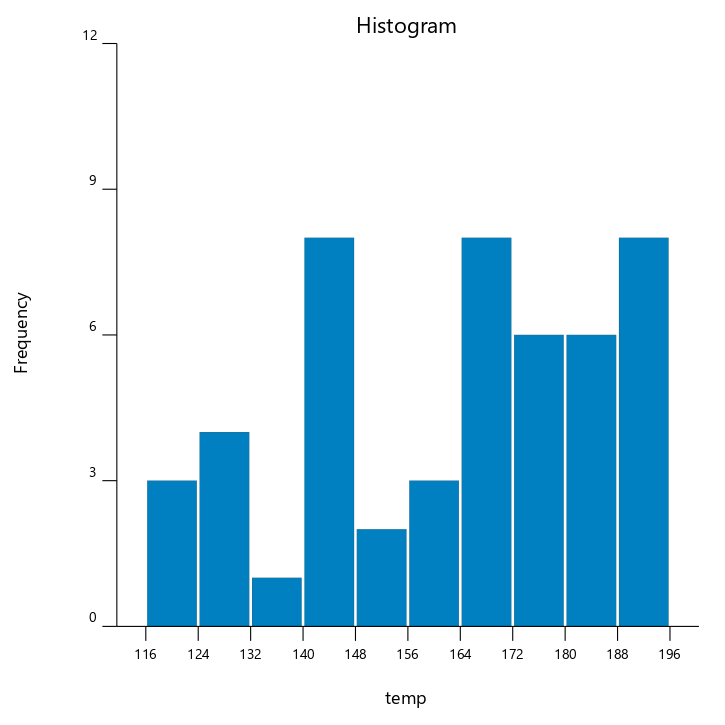
| Rotatable 3D scatterplots (shown) and other enhancements make it easier than ever to visualize your raw data before digging deep with Design-Expert’s powerful modeling tools. | In the Graph Columns node there is a new Histogram graph option. You can customize the number of bins, and choose to display frequency, density, or proportion on the Y axis. | |
| Graph Notebook | New Contrast Options | |
 |
 |
|
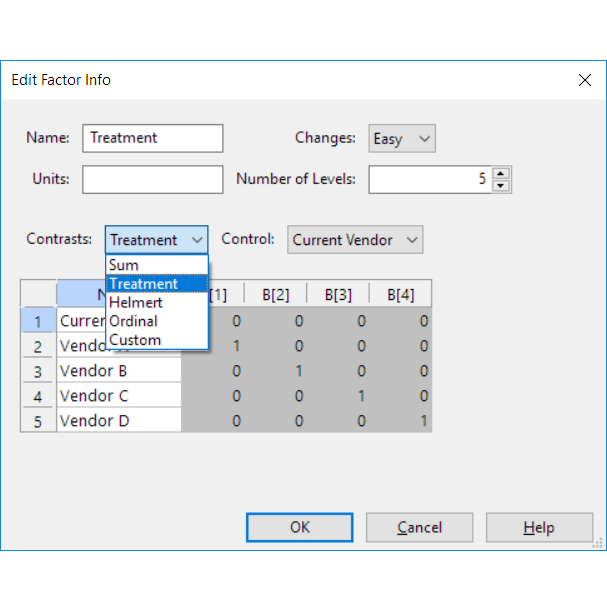
| The single-graph view in the Model Graphs tab has been replaced with a notebook. Lay out multiple graphs on one screen to provide a compelling at-a-glance view of your modeled responses. | New contrast options are available for categoric factors. This includes Treatment contrasts, which allow you to directly compare the effect of the different categoric levels with a reference level. |
Hard-to-change factors handled via split plots
- Two-level, general and optimal factorial split-plot designs: Make it far easier as a practical matter to experiment when some factors cannot be easily randomized.
- Half-normal selection of effects from split-plot experiments with test matrices that are balanced and orthogonal: The vital effects, both whole-plot (created for the hard-to-change factors) and sub-plot (factors that can be run in random order), become apparent at a glance!
- Power calculated for split plots versus the alternative of complete randomization: See how accommodation of hard-to-change factors degrades the ability to detect certain effects.
Other new design capabilities
- Definitive screening designs: If you want to cull out the vital few from many numeric process factors, this fractional three-level DOE choice resolves main effects clear of any two-factor interactions and squared terms (see screen shot of correlation matrix - more on that later).
- On the Factorial tab select a simple-sample design for mean-model only: Take advantage of powerful features in Design-Expert software for data characterization, diagnostics and graphics - for example with raw outputs from a process being run at steady-state.
Much-improved capabilities to confirm or verify model predictions
- Entry fields for confirmation data and calculation of mean results: Makes it really easy to see if follow-up runs fall within the sample-size-adjusted prediction intervals.
- Enter verification runs embedded within blocks as controls or appended to your completed design: Lend veracity to your ultimate model by these internal checks.
- Verification points displayed on model graphs and raw residual diagnostics: See how closely these agree to what's predicted by your model.
New and more-informative graphics
- Adjustably-tuned LOESS fit line for Graph Columns: Draw a curve through a non-linear set of points as you see fit. *(Locally weighted scatterplot smoothing.)
- Color-coded correlation grid for graph columns: Identify at a glance any factors that are not controlled independently of each other, that is, orthogonally; also useful for seeing how one response correlates to another.
Greater flexibility in data display and export
- Journal feature to export data directly to Microsoft Word or Powerpoint: Fast and formatted for you to quickly generate a presentable report on your experimental results.
- Improved copy/paste of Final Equation from the analysis of variance (ANOVA) report to Microsoft Excel: This not only saves tedious transcription of coefficients but it also sets up a calculator for you to 'plug and chug', that is, enter into the spreadsheet cells what values for the inputs you'd like to evaluate and see what the model predicts for your response.
- New XML* script commands for exporting point predictions: Helpful for situations where one wants to automate the transfer of vital outputs from Design-Expert to other programs. *(Extensible Markup Language)
More powerful tools for modeling
- All-hierarchical model (AHM) selection: Sort through all possible models up to the one you designed the experiment for, but all the while maintain hierarchy of terms so you do not end up with something ill-formulated.
- Special quartic Scheffé polynomial included in automatic selection for mixture modeling: Sometimes this added degree (4th!) of non-linear blending helps to better shape the response surface - making it better for predictive purposes.
More choices when custom-designing your experiment
- Enter a single factor constraint for response surface designs: Creates a 'hard' limit on inputs that cannot go beyond a certain point (such as zero time) physically or operationally.
More capability for numerical optimization
- Include Cpk* as a goal: Meet quality goals explicitly. *(A process capability index widely used for Six Sigma and Design for Six Sigma programs.)
Enhanced design evaluation
- One-sided option added to FDS* graph: Size your design properly for a verification experiment done to create a QBD** design space.
*(Fraction of design space) **(Quality by Design - a protocol promoted by the US Food & Drug Administration (FDA).)
Many things made nicer, easier, more configurable and faster
- Diagnostics report now can be sorted by any of the statistics listed: This enables a more informative ordering than by run number (the default).
Niceties that only statisticians might truly appreciate
- Mean correction for transformation bias when responses displayed in original scale: All you need to know is that our statisticians figured out how to eliminate a tricky, little-known bias!
- Propagation of error (POE) carried out to the second derivative: Makes POE more accurate - that's a good thing!
- Allow averaging of categoric factors when viewing a graph: Convenient for getting the big picture of where to find robust operating settings.
- Display confidence bands with or without POE added: Easier to match output with other programs that do not offer POE features like this.
- Add unblocked results to evaluation of blocked experiments: Aids in comparing designs on the basis of matrix measures.
Good news for network administrators
New more flexible and easier-to-use license manager with greater power toserve enterprise users: For example, network 'seats' can be checked out to individual laptops and multiple opening of the program on a specific computer will only use one seat.
Windows
|
Component
|
Minimum
|
|
Processor
|
1 GHz
|
|
Hard Drive
|
250 MB free space
|
|
RAM
|
2 GB
|
|
Display
|
1024x768
|
|
Operating System
|
Windows 8.1 Windows 10 Windows 11 |
Note that the software is incompatible with Windows XP. Please consider upgrading to one of the operating systems listed above.
macOS
|
Component
|
Minimum
|
|
Processor
|
1 GHz
|
|
Hard Drive
|
250 MB free space
|
|
RAM
|
2 GB
|
|
Display
|
1024x768
|
|
Operating System
|
macOS 10.15 or higher |
Network Installation
Minimum hardware and operating system requirements:
|
Component
|
Minimum
|
|
Hard Drive
|
100 MB free space
|
|
Operating System
|
Windows Server 2008 or newer |

.jpg)