最新版 QDA Miner v2024 更新於 2024/7/26
最新版 WordStat v2024 更新於 2024/3/18

公認是當今市場上唯一真正的混合方法質性數據分析軟體
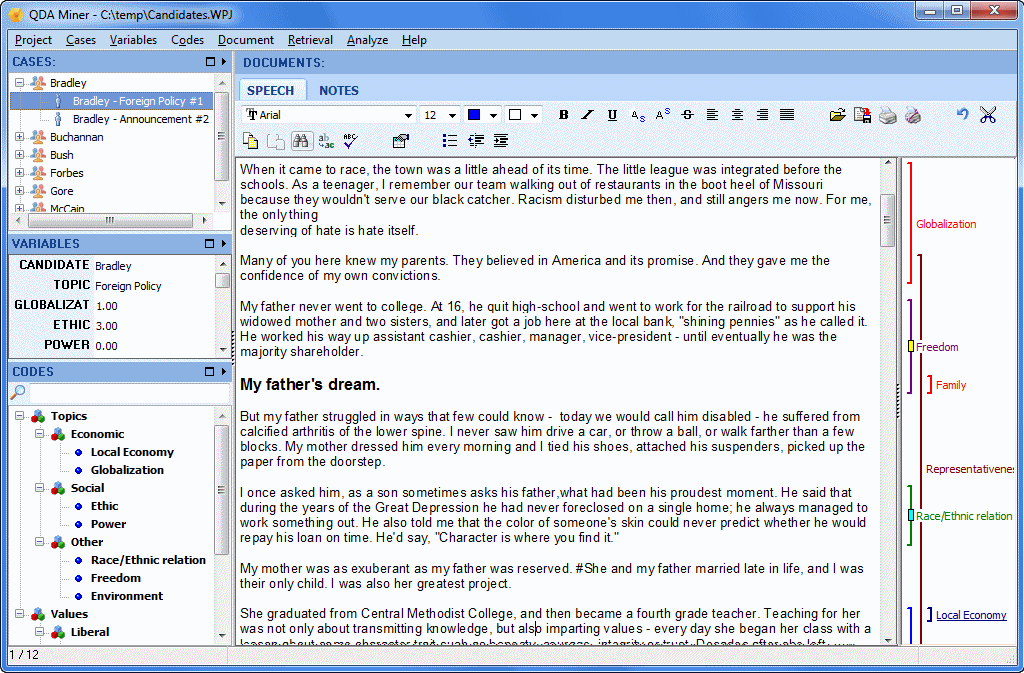
QDA Miner 是一套易於使用於編碼、註釋、擷取和分析大小集合的文件甚至是圖像資訊的混合模型的質性數據分析套件軟體。QDA Miner 常用於團體焦點訪談逐字稿、合法資料、雜誌文章甚至是整本書的分析。或者可以運用在繪圖、照片、繪畫及任何形式的視覺資料。它能與 SimStat 統計數據分析工具軟體,而且跟 WordStat 質性分析和文本採礦組元軟體緊密的集合,使您能夠靈活的分析文本以及包括數值和分類數據的相關結構性資訊。
誰會使用 QDA MINER?
QDA MINER 質性數據分析軟體,可適用於需要從大型或小型的文黨和圖像的集合中,進行編碼文字或圖片、註釋、搜尋、探索和提取信息的任何人,包括:
● 社會科學、醫學、心理學的研究人員
● 社會學家、政治學家和人類學家
● 商業智能分析師、市場研究人員、民調人員和 CRM 專業人員
● 犯罪分析、欺詐檢測專家、律師、律師助理專業人員
● 記者、歷史學家和研究助理
● 文件管理專家和圖書館員
QDA Miner 特色
QDA Miner is an easy to use qualitative analysis software for organizing, coding, annotating, retrieving, and analyzing collections of documents and images. QDA Miner offers more computer assistance for coding than any other qualitative research software on the market, allowing you to code documents more quickly but also more reliably. The qualitative data analysis software integrates advanced statistical and visualization tools to quickly identify patterns and trends, explore patterns in your coding, as well as describe, compare and test hypotheses. This is one of the reasons why QDA Miner is considered by many to be the first and still only true, mixed methods qualitative software on the market today.
Import from many sources
QDA Miner allows you to directly import content in multi-languages from many sources:
- Import documents: Word, PDF, HTML, PowerPoint, RTF, TXT, XPS, ePUB, ODT, WordPerfect.
- Import data files: Excel, CSV, TSV, Access
- Import from statistical software: Stata, SPSS
- Import from social media: Facebook, Twitter, Reddit, YouTube, RSS
- Import from emails: Outlook, Gmail, MBox
- Import from web surveys: Qualtrics, SurveyMonkey, SurveyGizmo, QuestionPro, Voxco, triple-s
- Import from reference management tools: Endnote, Mendeley, Zotero, RIS
- Import news transcripts from the LexisNexis and Factiva output files
- Import graphics: BMP, WMF, JPG, GIF, PNG. Automatically extract any information associated with those images such as geographic location, title, description, authors, comments, etc. and transform those into variables
- Import from XML databases
- ODBC database connection is available.
- Import projects from qualitative software: NVivo, Atlas.ti, Qdpx files
- Import and analyze multi-language documents including right-to-left languages
- Monitor a specific folder, and automatically import any documents and images stored in this folder or monitor changes to the original source file or online services.
Organize your data
Several features allow you to easily organize your data in ways that make your coding and analysis process straightforward:
- Quickly group, label, sort, add, delete documents or find duplicates.
- Assign variables to your documents manually or automatically using the Document Conversion Wizard, ie: date, author, or demographic data such as age, gender, or location.
- Easily reorder, add, delete, edit, and, recode variables.
- Filter cases based on variable values or whether a document contains codes or not.
- Transform coded text into variables.
- This is very useful to extract relevant metadata from unstructured documents or transform an unstructured project into a structured one.
Manage your codebook
Creating a codebook is an important step in a qualitative data analysis project. QDA Miner provides dedicated tools that help you create and manage your codebook in a creative way:
- Easily create and edit a codebook.
- Assign a color and a memo to a code.
- Associate a list of keywords to code to easily retrieve text segments that contain those keywords.
- Dictionaries created using WordStat may be imported into QDA Miner and transformed into codes and categories.
- Save your codebook on disk in a separate file so it can be imported and used for another project.
Perform on-screen coding
Code text segments and images with an intuitive qualitative tagging process:
- Use on-screen coding and annotation of texts and images with easy drag and drop assignment of codes to text segments and images.
- Use the grid view mode that provides a convenient and very efficient way to code open-ended questions or short comments.
- Several features offer greater flexibility and ease-of-use, such as code splitting, merging, easy resizing of coded segments, interactive code searching and replacement, or virtual grouping.
- Add hyperlinks to text selection or coded segments so you can move to a web page, file, another case in your project, or other coded or uncoded text segments.
- Display a graphical overview of the coding of your current document to get a quick glimpse of the spatial distribution of the coding.
Speed up your coding
Code your documents more quickly and more reliably with seven text search and retrieval tools:
- The Keyword Retrieval tool can search for hundreds of keywords and key phrases related to the same idea or concept, allowing you to locate all references to a single topic.
- The Section Retrieval tool is ideal to automatically retrieve and code sections in structured documents.
- The Query by Example tool can be trained to retrieve text segments having similar meanings to the examples you feed in.
- The Cluster Extraction tool will group similar sentences or paragraphs into clusters and allows you to code these using a flexible drag-and-drop editor.
- The Code Similarity search will retrieve all text segments similar to those that have already been coded. One may even search for items similar to codes defined in previous coded projects.
- The Date and Location extraction tool is ideal to quickly locate and tag references to dates or geographic locations.
Analyze, visualize, explore
Many statistical and visualization tools have been integrated into QDA Miner to quickly identify patterns and trends, explore data, describe, compare, and test hypotheses.
- Use an interactive word cloud and word frequency table to obtain words frequency on any document variable or on results of retrieval operations (text, coding, section or keyword retrieval) as well as for a single document or for text displayed in the grid view.
- Analyze codes frequency, explore connections between codes using Cluster Analysis, Link Analysis, Sequence Analysis or Multidimensional Scaling,
- See the relationship between variable values and codes using Crosstabs, Correspondence Analysis, or Heatmaps.
- Compute statistical tests such as Chi-Square, Pearson Correlation, and so on, to help you identify the strongest relationships. No need to purchase a separate statistical software.
- Create a grid containing all coded text segments and/or comments and get a compact view of coded material using the Quotation Matrix.
Plot events using GIS Mapping and Time Tagging
All these innovative features make QDA Miner the most powerful geotagging qualitative tool on the market:
- Associate geographic and time coordinates to text selection or to any coded text segment or graphic area, allowing one to locate events both in space and time.
- Geographic coordinates can be imported from KML or KMZ files or cut from Google Earth and pasted into QDA Miner. One may then easily jump from a geo-link to Google Earth.
- A flexible link-retrieval tool may be used to filter and select relevant geo-linked or time-tagged events and display them either on a geographic map or a timeline.
- In QDA Miner, users can retrieve coded data, based on time and location, and plot events on timelines and maps.
Use the integrated geocoding service
Transform references to cities, states/provinces, countries, postal codes, and IP addresses into geographical coordinates. The GISViewer mapping module allows you to create interactive plots of data points, distribution maps, and heat maps.
Get unparalleled teamwork support
QDA Miner supports teamwork in highly effective ways. Dedicated functions make collaboration an easy task:
- Enhanced teamwork support features like a flexible multi-users settings tool allow you to define for each team worker what they can or cannot do.
- Get assistance in duplication and distribution of projects to team members.
- A powerful merge feature bringing together, in any single project, codings, annotations, reports, and log entries of different coders working independently.
- A unique inter-rater agreement assessment module may be used to ensure the coding reliability of multiple coders.
Track changes
A powerful command log keeps track of every project access, coding operation, transformation, query, and analysis performed. Useful to document the qualitative analysis process and supervising teamwork.
Export and share results
In QDA Miner, you can easily create presentation-quality graphics such as bar charts, pie charts, bubble charts, and concept maps, and save them as an image (png, jpeg or BMP, WMF, EMF). Tables with statistics can also be easily exported to disk in different file formats including Word, Excel, CSV, HTML, XML, and delimited ASCII files, allowing the data to be further analyzed using a statistical program. QDA Miner statistical tables can export statistics directly to SPSS, Stata 8 to 15 or Tableau Software.
系統需求
Windows
QDA Miner requires minimal resources itself, running on as little as 256 MB RAM and 40 MB of disk space. But remember, your operating system also needs resources:
Windows XP, 2000, Vista, Windows 7, 8 and 10: 1GB RAM (2GB recommended).
Windows 11: 4GB RAM minimum (8GB recommended) and 64GB disk space
MAC OS & Linux
QDA Miner will run on a Mac OS using virtual machine solution or Boot Camp, and on Linux computers using CrossOver or Wine.
版本比較
點擊圖片可放大觀看
.png) ProSuite
ProSuite
ProSuite 是 Provalis Research 的整合式文字分析工具(QDA Miner、WordStat、SimStat )的集合,讓人們可以探索、分析和關聯結構化和非結構化資料。 Provalis Research 文字分析工具允許使用 QDA Miner 對文件和圖像執行高級電腦輔助定性編碼,對文字資料應用 WordStat 強大的內容分析和文字探勘功能,並對數字和分類資料執行高級統計分析使用 SimStat。 ProSuite 不會將研究人員和分析師限制在單一文字分析方法上,而是允許他們選擇最適合研究問題或可用資料的方法。
IMPORT FROM MANY SOURCES
• Import Word, Excel, HTML, XML, SPSS, Stata, NVivo, PDFs, as well as images. Connect and directly import from social media, emails, web survey platforms, and reference management tools.
APPLY QUALITATIVE CODING TO DOCUMENTS
• Code and annotate text segments and images using features that provide greater flexibility and ease of use.
PERFORM ADVANCED TEXT SEARCH
• Achieve faster and more reliable coding with more than seven text search tools including keyword search, section retrieval, a powerful query-by-example search that learns from the user, and a unique cluster extraction that automatically groups similar text segments.
ANALYZE USING STATISTICAL AND VISUALIZATION TOOLS
• Explore data, and identify patterns and trends using integrated statistical and visualization tools such as clustering, multidimensional scaling, or correspondence analysis.
EXTRACT THE MOST SALIENT TOPICS USING TOPIC MODELING
• Get a quick overview of the most salient topics from very large text collections using state-of-the-art automatic topic extraction based on words, phrases, and related words (including misspellings).
EXPLORE CONNECTIONS
• Explore relationships among words or concepts and retrieve text segments associated with specific connections.
RELATE TEXT WITH STRUCTURED DATA
• Explore relationships between unstructured text and structured data such as dates, numbers or categorical data for identifying temporal trends or differences between subgroups or for assessing relationships with ratings or other kinds of categorical or numerical data with statistical and graphical tools (correspondence analysis, heatmaps, bubble charts, etc.).
CATEGORIZE YOUR TEXT DATA USING DICTIONARIES
• Achieve full text analysis automation using existing dictionaries or create your own categorization model with unique computer assistance for building dictionaries.
CATEGORIZE YOUR TEXT DATA USING MACHINE LEARNING
• Develop and optimize automatic document classification models using Naïve Bayes and K-Nearest Neighbours.
PERFORM GEOTAGGING AND TIME TAGGING
• Associate geographic and time coordinates to text segments. Retrieve coded data, based on time and location, and plot events on timelines and maps.
TRANSFORM UNSTRUCTURED TEXT INTO INTERACTIVE MAPS (GIS MAPPING)
• Relate unstructured text data with geographic information and create interactive plots of data points, thematic maps, and heatmaps, along with a geocoding web service for transforming location names, postal codes, and IP addresses into latitude and longitudes.
PERFORM STATISTICAL ANALYSIS AND BOOTSTRAPPING
• Use a wide range of statistics, intuitive data, and output management features as well as a scripting language to automate statistical analysis and to write small applications, interactive tutorials, computer-assisted interviewing systems.
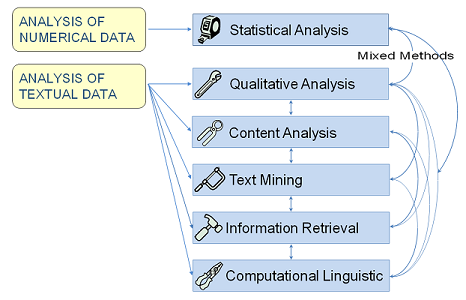
先進的內容分析和文本挖掘軟體,具有無與倫比的操控性和分析能力!
WordStat 是一個靈活且易於使用的文本分析軟件 - 無論您是否需要快速提取主題和趨勢的文本挖掘工具,還是要用國家級最先進的質量內容分析工具進行仔細和精確的測量。 WordStat 利用和 SimStat 無縫整合 - 我們的數據統計分析工具 - 和 QDA Miner - 我們的質性數據分析軟體 - 為您的文本分析和其相關的結構化訊息,包括數值和分類數據,帶來前所未有的靈活性。
特色
Import from many sources
WordStat allows you to directly import content in multi-languages from many sources:
- Import documents: Word, PDF, HTML, PowerPoint, RTF, TXT, XPS, ePUB, ODT, WordPerfect.
- Import data files: Excel, CSV, TSV, Access
- Import from statistical software: Stata, SPSS
- Import from social media: Facebook, Twitter, Reddit, YouTube, RSS
- Import from emails: Outlook, Gmail, MBox
- Import from web surveys: Qualtrics, SurveyMonkey, SurveyGizmo, QuestionPro, Voxco, triple-s
- Import from reference management tools: Endnote, Mendeley, Zotero, RIS
- Import graphics: BMP, WMF, JPG, GIF, PNG. Automatically extract any information associated with those images such as geographic location, title, description, authors, comments, etc. and transform those into variables
- Import from XML databases
- ODBC database connection is available.
- Import projects from qualitative software: NVivo, Atlas.ti, Qdpx files
- Import and analyze multi-language documents including right-to-left languages
- Monitor a specific folder, and automatically import any documents and images stored in this folder or monitor changes to the original source file or online services.
Organize your data
Several features allow you to easily organize your data in ways that make your analysis process straightforward:
- Quickly group, label, sort, add, delete documents or find duplicates.
- Assign variables to your documents manually or automatically using the Document Conversion Wizard, ie: date, author, or demographic data such as age, gender, or location.
- Easily reorder, add, delete, edit, and recode variables.
- Filter cases based on variable values.
Quickly extract meaning using Explorer Mode
Quickly and easily extract meaning from large amounts of text data using Explorer mode, specially made for those with little text mining experience.
Identify the most frequent words, phrases, and extract the most salient topics in your documents with the topic modeling tool. At any time, you can switch to Expert mode which gives you access to all WordStat’s features.
Explore document content using Text Mining
In a few seconds, explore the content of large amounts of unstructured data and extract insightful information:
- Extract the most frequent words, phrases, expressions.
- Quickly extract themes using clustering or 2D and 3D multidimensional scaling on either words or phrases.
- Easily identify all keywords that co-occur with a target keyword by using the Proximity Plot.
- Explore relationships among words or concepts with the Link Analysis feature.
- Fine-tune the analysis by applying the keyword co-occurrence criterion (within a case, a sentence, a paragraph, a window of n words, a user-defined segment) as well as clustering methods (first and second-order proximity, choice of similarity measures).
- Explore the similarity between concepts or documents using hierarchical clustering, multidimensional scaling, link analysis, and proximity plot.
Use Topic Modeling to extract the most salient topics
Get a quick overview of the most salient topics from very large text collections using state-of-the-art automatic topic extraction by applying a combination of natural language processing and statistical analysis (NNMF or factor analysis) not only on words but also on phrases and related words (including misspellings).
While in hierarchical cluster analysis, a word may only appear in one cluster, topic modeling may result in a word being associated with more than one topic, a characteristic that more realistically represents the polysemous nature of some words as well as the multiplicity of contexts of word usages.
Explore connections
Explore connections among words or concepts using a network graph. Detect underlying patterns and structures of co-occurrences using three layout types: multidimensional scaling, a force-based graph, and a circular layout.
Graphs are interactive and may be used to explore relationships and to retrieve text segments associated with specific connections.
Relate text with structured data
Explore relationships between unstructured text and structured data:
Identify temporal trends, differences between subgroups, or assess relationships with ratings or other kinds of categorical or numerical data with statistical and graphical tools (deviation table, correspondence analysis, heatmaps, bubble charts, etc.).
Assess the relationship between word occurrence and nominal or ordinal variables using different association measures: Chi-square, Likelihood ratio, Tau-a, Tau-b, Tau-c, symmetric Somers’ D, asymmetric Somers’ Dxy and Dyx, Gamma, Person’s R, Spearman’s Rho.
Categorize your text data using dictionaries
Achieve full-text analysis automation using existing dictionaries or create your own categorization model of words and phrases.
In the dictionary, one can implement Boolean (AND, OR, NOT) and proximity rules (NEAR, AFTER, BEFORE) and use Regular Expression formulas to quickly extract specific information from text data.
Dictionary moderated lemmatization and stemming are available in several languages and an automatic word substitution option allows you to substitute several words with a target keyword. A user-defined list of stop words is available in several languages to avoid nonessential frequent words such as he, she, it, etc in the analysis.
Get unique assistance for dictionary building
Get truly unique computer assistance for taxonomy building with tools for extracting common phrases and technical terms and for quickly identifying in your text collection misspellings and related words (synonyms, antonyms, holonyms, meronyms, hypernyms, hyponyms).
Automatically classify your text data using machine learning
Develop and optimize automatic document classification models using Naïve Bayes and K-Nearest Neighbours. There are numerous validation methods that users can select: leave-but-one, n-fold cross-validation, split sample. An experimentation module can be used to easily compare predictive models and fine-tune classification models.
Classification models may be saved to disk and applied later in QDA Miner, in a standalone document classification utility program, a command-line program or a programming library.
Return to the source document in one click
Verify or dig deeper into your analysis by going back to the text from almost any feature, chart, or graph using Keyword Retrieval or Keyword-in-Context to retrieve sentences, paragraphs, or whole documents. This is particularly helpful when building taxonomies or for word-sense disambiguation.
The retrieved text segments can be sorted by keyword or any independent variable. You can attach QDA Miner codes to retrieved segments or export them to disk in tabular format (Excel, CSV, etc.) or as text reports (MS Word, RTF, etc.).
Perform qualitative coding
Combine WordStat with a state-of-the-art qualitative coding tool (QDA Miner), for more precise exploration of data or a more in-depth analysis of specific documents or extracted text segments when needed.
Transform unstructured text into interactive maps (GIS mapping)
Relate unstructured text data with geographic information and create interactive plots of data points, thematic maps, and heatmaps, along with a geocoding web service for transforming location names, postal codes and IP addresses into latitude and longitudes.
Automatically extract names and misspellings
Automatically extract named entities (names, technical terms, product and company names) that can be added to the categorization dictionary using an easy drag-and-drop-operation.
Misspellings and unknown words are automatically extracted and matched with existing entries in the user dictionary and may be quickly added to the dictionary.
Export results
Export text analysis results to common industry file formats such as Excel, SPSS, ASCII, HTML, XML, MS Word, to popular statistical analysis tools such as SPSS and STATA and to graphs such as PNG, BMP, and JPEG.
Transform text using Python scripts
Use Python script and its full range of open-source libraries to preprocess or transform text documents for analysis in WordStat.
系統需求
Windows
WordStat requires minimal resources itself, running on as little as 256 MB RAM and 40 MB of disk space. But remember, your operating system also needs resources:
Windows XP, 2000, Vista, Windows 7, 8 and 10: 1GB RAM (2GB recommended).
Windows 11: 4GB RAM minimum (8GB recommended) and 64GB disk space
MAC OS
WordStat will run on a Mac OS with Intel chips using virtual machine solutions (Parallels, VMWare Fusion, or Virtual Box) or using Boot Camp. It won’t run on a newer Mac with a M1 or M2 chip.
共有 SIMSTAT / MVSP 請點選觀看
SIMSTAT
統計分析和引導功能強大且易於使用的輸出功能.jpg)
Simstat 超越單純的統計分析。它提供輸出管理功能,這是沒有在其他任何程式中能找到的,並且擁有自己的腳本語言,可進行自動統計分析和編寫小型應用程式,還具有多媒體功能的互動式教學,以及電腦輔助訪問系統。
Simstat supports not only numerical and categorical data, dates and short alpha-numeric variables but also memos and documents variables allowing one to store in the same project file responses to open-ended questions, interview transcripts, full reports, etc. Since all Provalis Research tools share the same file format, one can easily perform statistical analysis on numerical and categorical data using Simstat, perform qualitative coding on stored documents using QDA Miner or apply the powerful content analysis and text mining features of WordStat on those same documents. Moreover, the coexistence of numerical, categorical and textual data in the same data file gives a unique ability to explore relationships between numerical and textual variables or to compare qualitative codings or content categories between subgroups of individuals.
STATISTICAL ANALYSIS FEATURES
● DESCRIPTIVE statistics (mean, variance, standard deviation, etc.).
● FREQUENCY analysis including frequencies table, descriptive statistics, percentiles table, barchart, pie chart, Pareto chart, histogram, normal probability plot, box-&-whiskers plot and cumulative distribution plot.
● CROSSTABULATION: normal crosstabulation and INTER-RATERS AGREEMENT table,nominal statistics (chi-square, Pearson’s Phi, Goodman-Kruskal’s Gamma, Contingency coefficient), ordinal statistics (Kendall’s tau-b and tau-c, Pearson’s R, symmetric and asymmetric Somers’ D, Dxy and Dyx), inter-raters agreement statistics (percentage of agreement, Cohen’s Kappa, Scott’s Pi, Krippendorf’s r and R-bar, free marginal correction for nominal and ordinal measure), 3-D bar chart.
● BREAKDOWN analysis with multiple Box-and-Whiskers plot.
● MULTIPLE RESPONSES frequency and crosstabulation analysis.
● PAIRED AND INDEPENDENT T-TESTS with effect size measures (r and d), error bar graph, barchart, dual histogram.
● ONEWAY ANALYSIS OF VARIANCE with post hoc tests (LSD, Tukey’s HSD, Scheffé’s test), effect size measures, error bar graph, barchart, deviation chart.
● GLM ANOVA/ANCOVA (up to 5 factors and covariates) including detailed ANOVA table, 3 different adjustment methods for unequal cell sizes (regression, nonexperimental, hierarchical), multiple regression statistics, test of change of R-Square, regression equation (B, standard error of B, beta, confidence, interval of B, zero-order, semi-partial and partial correlations, tolerance level, F, significance), residuals caseplot with Durbin-Watson statistic, standardized residuals scatterplot, normal probability plot of residuals, ability to save predicted and residual values.
● CORRELATION MATRIX including covariance and cross product deviation, user-specified confidence interval, scatterplot matrix.
● PARTIAL CORRELATION MATRIX with interactive correlation matrix for inclusion of exclusion of control variables, computation of confidence intervals, etc.
● REGRESSION analysis including linear and 7 nonlinear regressions (quadratic, cubic, 4th and 5th degree polynomial, logarithmic, exponential, inverse), regression equation, analysis of variance, Durbin-Watson statistics, scatterplot, residuals caseplot, standardized residuals scatterplot, normal probability plot of residuals, ability to save predicted and residual values.
● MULTIPLE REGRESSION analysis including 5 different regression methods (hierarchical entry, forward selection, backward elimination, stepwise selection, enter all variables), P to enter, P to remove, and tolerance criteria, ANOVA table, test of change ANOVA table, regression equation (B, standard error of B, beta, confidence, interval of B, zero-order, semi-partial and partial correlations, tolerance level, F, significance), residuals caseplot, Durbin-Watson statistic, standardized residuals scatterplot, normal probability plot of residuals, ability to save predicted and residual values.
● TIME SERIES analysis including data transformation (ex.: remove mean, lag, etc.), auto-correlation diagnostic (ACF and PACF plot), smoothing techniques (moving average,running median), control bars with user-specified confidence interval.
SINGLE-CASE EXPERIMENTAL DESIGN analysis with descriptive statistics, interrupted time-series graph, various graphical judgmental aids such as smoothing (moving average and running median), trend lines and control bars.
● RELIABILITY analysis with item, inter-item and item-total statistics, split-half reliability statistics, internal consistency measures (Cronbach’s alpha, etc.).
● CLASSICAL ITEM ANALYSIS for multiple-choice item questionnaires.
● FACTOR ANALYSIS including principal components analysis and image covariance factor analysis, Q-type factor analysis, varimax rotation, scree plot, etc..
● SENSITIVITY ANALYSIS with false-positives and false negatives statistics, sensitivity and specificity statistics, ROC curve (Receiver operating characteristics), error rate graph.
● NONPARAMETRIC analysis including binomial test, one sample chi-square test, runs test, McNemar test, Mann-Whitney U test, Wilcoxon t-test, sign test, Kruskal-Wallis ANOVA, Friedman two way ANOVA, Kolmogorov-Smirnov test for 2 samples and goodness of fit test, Moses test of extreme reactions, median test (2 or more samples).
● NONPARAMETRIC ASSOCIATION MATRIX including Spearman’s R, Somer’s D, Dxy and Dyx, Goodman Kruskal’s Gamma, Kendall’s Tau-a, Tau-b, Kendall Stuart’s Tau-c, etc.
● BOOTSTRAP RESAMPLING analysis including resampling of 7 univariate and 21 bivariate estimators, descriptive statistics, percentile table, nonparametric confidence intervals, nonparametric power analysis, variable sample size, random sampling simulation, histogram.
● FULL ANALYSIS BOOTSTRAP resampling on almost every analysis (frequency, crosstab, multiple regression, reliability, nonparametric tests, etc.).
OTHER FEATURES
● Integer weighting of cases using another variable.
● Runs LOGISTIC, a freeware logistic regression program written by Gerard L. Dallal.
● SIMCALC probability calculator computes probabilities for 9 types of test/distribution as well as confidence intervals for proportions, mean, and correlation.
DATA MANAGEMENT FEATURES
The data window is a spreadsheet like data editor where values can be entered, browsed, or edited.
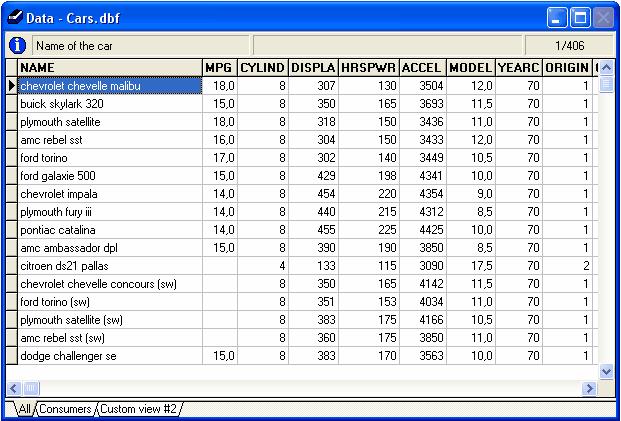
● Data file can store up to 2035 variables (or fields).
● Supports plain text as well as Rich Text Format documents.
● Imports comma or tab separated text files, DBase, FoxPro, Excel, MS Access, Paradox, Lotus, Quattro Pro, SPSS/PC+, and SPSS for Windows files.
● Exports comma or tab separated text files, DBase, FoxPro, Excel, MS Access, Paradox, Lotus, Quattro Pro, SPSS/PC+, and XML files.
● Allows merging and aggregation of data files.
● Supports variable and value labels and up to 3 missing values.
● Cases can be filtered using complex xBase expressions.
● Data grid may be sorted on one or several variables.
● Customizable grid provides alternate view of the data file
● Supports data transformation (including conditional transformation), recoding, ranking. Provides more than 50 transformation functions including trigonometric, statistical, random number functions.
OUTPUT MANAGEMENT FEATURES
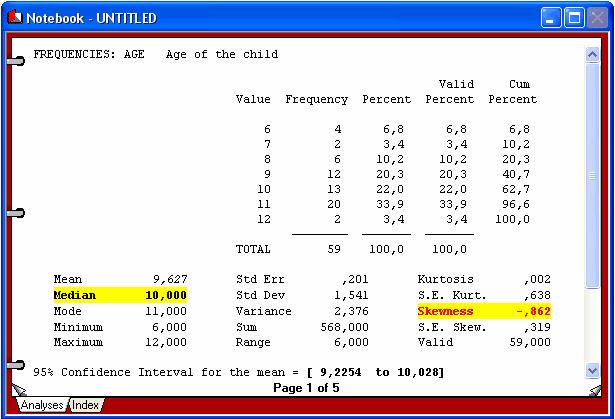
The Notebook window displays the statistical output for all analysis performed during a session. The notebook metaphor provides an efficient way to browse and manage outputs.
● The text output of each analysis is displayed on a separate page.
● Each page can be annotated or edited.
● Empty pages can be inserted to put down ideas or remarks, sketch an analysis plan, or write down interpretation of results.
● Tabs can be added to create sections in the notebook allowing storage of different kinds of analysis in different sections of the notebook.
● An index of all analysis is automatically generated. This index can be used to quickly locate and go to a specific page, move pages within the notebook, or delete some pages.
● Rich Text notebook allows one to change font attributes (bold, underline, strikeout, italic) and font colors.
● Highlight tool allows to color passages of text.
● Notebooks can be exported in Rich Text Format or in plain text.
CHART CREATION AND MANAGEMENT FEATURES
All high-resolution charts created during a session are displayed in the Chart window. This window can be used to view the charts and perform various operations on individual charts or on the entire collection of charts. For example, you can modify the various chart attributes, save those charts to disk, export them to another application using the clipboard or disk files, or print them. It is also possible to delete a specific chart or to modify the order of those charts in this window.
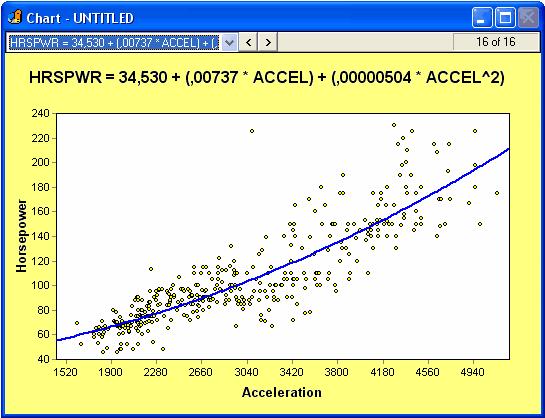
● Control of axis, titles, legends, colors, lines, etc.
● Charts can be imported on disk or copied to the clipboard in Window bitmap or metafile format
● Charts can also be copied as tab separated values and imported by another charting application.
SCRIPT, EDUCATIONAL, & MULTIMEDIA FEATURES
The script window is used to enter and edit commands. Those commands can be either read from a script file on disk, typed in by the user or automatically generated by the program. When used with the RECORD feature, the script can also be used as a log window to keep track of the analysis performed during a session. Those commands may then be executed again, providing an efficient way to automate statistical analysis. Additional commands also allows one to create demonstration programs, computer assisted teaching lessons, and even computer assisted data entry.
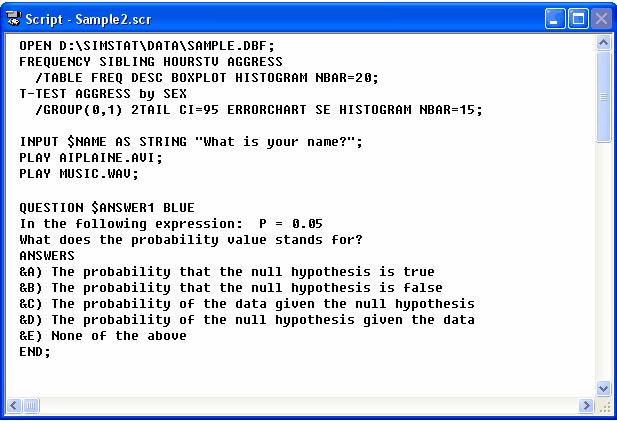
● Statistical analysis, data filtering and transformation commands
● Record script feature to automatically generate commands corresponding to operations performed with menus and dialog boxes.
● Flow control features such as IF-THEN-ELSE statements, GOTO or GOSUB commands, RUN command to run external programs, etc.
● Can read, write, and perform mathematical operations on user defined variables or any database field
● Create menus, text boxes, input boxes, dialog boxes, multiple items questions, etc. (responses from a user can be stored in memory variables or in a data file)
● Multimedia features: play sound (.WAV), music (.MDI), and movie (.AVI) files, display graphics (.BMP) and text.
系統需求
SimStat requires minimal resources itself, running on as little as 256 MB RAM and 40 MB of disk space. But remember, your operating system also needs resources:
Windows XP, 2000, Vista, Windows 7, 8 and 10: 1GB RAM (2GB recommended).
Windows 11: 4GB RAM minimum (8GB recommended) and 64GB disk space
 什麼是 MVSP?
MVSP 是一個價格低廉但功能強大的可與電腦相容的多變量分析程式,可進行各種協調和叢集分析 (cluster analyses)。它為生態學和地質學到社會學和市場研究等領域的分析數據提供一個簡單的方法。 MVSP 是在超過 50 個國家中被數百個網站所使用。 MVSP 的分析結果已發表在眾多的期刊,包括科學、自然、生態、Journal of Petroleum Geology 和 Journal of Biogeography。
一旦您的數據進行了分析,您就可以直接繪製結果。選擇您想看到的協調軸 (the ordination axes) 和散點圖 (scattergrams) 的繪製。自動生成叢集分析 (cluster analyses)結果的樹狀圖 (Dendrograms)。而這些圖表可以在各種輸出設備所列印。
特色
● Data matrix manipulation: data may be transposed, transformed (transformations available include logarithms to base 10, e, and 2, square root, and Aitchison’s logratio for percentage data), converted to percentages, proportions, standard scores, octave class scale, or range through format for stratigraphic studies, and rows and columns may be selected for deletion
● Data import and export; Lotus 1-2-3 and Symphony and Cornell Ecology Programs
● Principal Coordinates Analysis, performed with the following options: use any type of input similarity matrix, user defined minimum eigenvalues and accuracy level
● Principal Components Analysis, with the following options: correlation or covariance matrix, centered or uncentered analysis, user defined minimum eigenvalues, including Kaiser’s and Jolliffe’s rules for average eigenvalues, user defined accuracy level.
● Correspondence Analysis, with these options: Hill’s detrending by segments, choice of eigenanalysis or reciprocal averaging algorithm, weighting of rare or common taxa and scaling to percentages, user defined minimum eigenvalues and accuracy level.
● Nineteen different similarity and distance measures, including Euclidean, squared Euclidean, standardized Euclidean, cosine theta (or normalized Euclidean), Manhattan metric, Canberra metric, chord, chi-square, average, and mean character difference distances; Pearson product moment correlation and Spearman rank order correlation coefficients; percent similarity and Gower’s general similarity coefficient; Sorensen’s, Jaccard’s, simple matching, Yule’s and Nei’s binary coefficients.
● Cluster analysis, with the following options: seven strategies (UPGMA, WPGMA, median, centroid, nearest and farthest neighbor, and minimum variance), constrained clustering in which the input order is maintained (e.g. stratigraphic studies), randomized input order, integral dendrogram production. Separate utility program allows data matrices to be sorted in the order of the dendrograms; allows patterns to be seen in the data.
● Diversity indices, with the following options: Simpson’s, Shannon’s, or Brillouin’s indices, choice of log base, evenness and number of species can also be calculated.

