
 EasyCharts 報表&圖形工具軟件,強大的第三方的報表和圖形工具 擁有無法比擬的畫圖的效果。
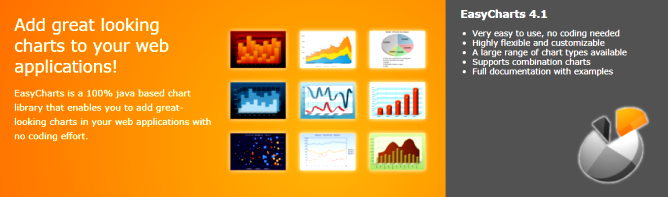
EasyCharts是100%基於Java的圖表庫,您可以在你的Java應用程序、網頁、Web的應用程序添加少量的編碼做出非常漂亮的圖表。
EasyCharts支持的圖表和圖表的廣泛組合,是Java開發人員常用的工具,為開發提供了強大,靈活的工具。
|
Bar and Column Charts
Create bar charts with multiple data series, configurations, styles and colors. Bars can be placed vertically or horizontally, side-by-side, stacked, or behind each other. |
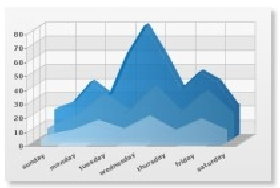
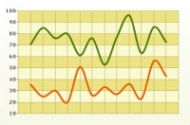
Line and Area Charts
Create line and area charts with different line styles, stacked data series, mouse-over labels, and sample point markers. The charts can be zoomed by dragging the mouse across the chart data. |
|
Plotter and Bubble Charts
Create a wide array of plotter and bubble charts with many different configurations. Set the size and shapes of the plots. Display free standing plots or connect to form data series. |
Combination Charts
Combine different bar, line, and area charts into new great looking combination charts. There is no limit to the number of charts that can be stacked on top of each other.
|
|
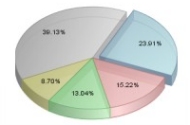
Pie Charts
Create 2D or 3D pie charts with multiple data series, detached pies, mouse-over labels, and drilldown functionallity. |
Gauge and Dial Charts
Gauge and dial charts lets you create speedometer-style charts for network utilization and other applications. |


- Platform: Windows, Linux, MAC, Mobile
- Requirements: Java VM
Opinio

- Conduct online surveys using Opinio
Create, publish, and manage all your online web surveys using the powerful features of the Opinio survey software. - Create survey forms that fit your company profile
Design any type of survey questionnaire using Opinio’s rich set of question types and response variations, then customize the visual appearance of the form to fit your current web layout. - Publish surveys and track respondents
Invite survey respondents through the built-in email invitation module, track the respondents while they answer, and send automatic reminders to late respondents. - Create instant reports or export the survey data
You can create informative and detailed reports of your survey data the instant responses are available for your survey, or you can export the data to SPSS or Excel for further analysis. - Covers all your survey needs
Opinio supports multiple users, multilingual surveys, survey collaboration, powerful features such as skip logic and piping, and a highly scalable architecture so it will cover the survey needs for everyone in your organization.
Network Probe
- network monitor and protocol analyzer
Do you know what's really traveling through your network? Are you having problems finding the sources of network slowdowns?
Network Probe is the ultimate network monitor and protocol analyzer to monitor network traffic in real-time, and will help you find the sources of any network slow-downs in a matter of seconds.
Collect and analyze data from multiple probes using the Network Probe Enterprise version for a total traffic overview of all your networks.