最新版 LiveNX 24.2.3 更新於 2024/10/18
最新版 Omnipeek 24.2 更新於 2024/7/14
最新版 LiveWire (原名 Omnipliance Insight / Micro)
Omni 平臺實現了從單一控制臺進行全網範圍的分析與故障診斷,包括廣域網、無線網路。
Omnipeek 不僅僅是一個令人印象深刻的數據包分析,統計數據和可視化集合。憑藉業內最佳的網絡分析工作流程,Omnipeek可以輕鬆深入挖掘,查看,比較,發現並最終縮短平均分辨率(MTTR)。Omnipeek為工程師提供快速分析和洞察力,使他們能夠快速做出關於網絡速度,應用程序性能和安全性的最佳決策。
特色功能
• Accelerate Mean-Time-To-Resolution (MTTR) with lightning fast visualization and interaction with metadata, flows, files, and packet data
• Gain unprecedented visibility into networks and applications including classification of layer 7 traffic
• Analyze traffic from any remote network segment, including Ethernet, 1/10/40/100 Gigabit, 802.11, and voice and video over IP using LiveCapture network capture and analytics appliances
• Monitor voice and video over IP traffic in real time including high-level multi-media summary statistics, comprehensive signaling and media analyses, and call play back
• View packet-based analytics by flows (conversation pairs) and visualize them in intuitive graphical displays
• Capture and analyze 802.11n and 802.11ac wireless traffic from already deployed access points from Cisco, Aruba, and other leading vendors
• Expert analysis — built-in, real-time analysis of hundreds of common network problems
• Automatic alerts based on Expert analysis, or when configured network policies are violated
OmniPeek 系統需求
Recommended System Requirements
The system requirements for Omnipeek are:
◦ Windows 11, Windows 10, Windows Server 2022, Windows Server 2019, Windows Server 2016
Omnipeek supports most rack mount, desktop and portable computers as long as the basic system requirements to run the supported operating systems are met. Depending on traffic and the particular usage of Omnipeek, the requirements may be substantially higher.
The following system is recommended for Omnipeek:
◦ Intel Core i3 or higher processor
◦ 4 GB RAM
◦ 40 GB available hard disk space
Factors that contribute towards superior performance include high speed and multiple CPUs, additional RAM, high
performance disk storage subsystem, and as much additional hard disk space as is required to save the trace files
that you plan to manage.
網絡性能可視化和分析領域的領導者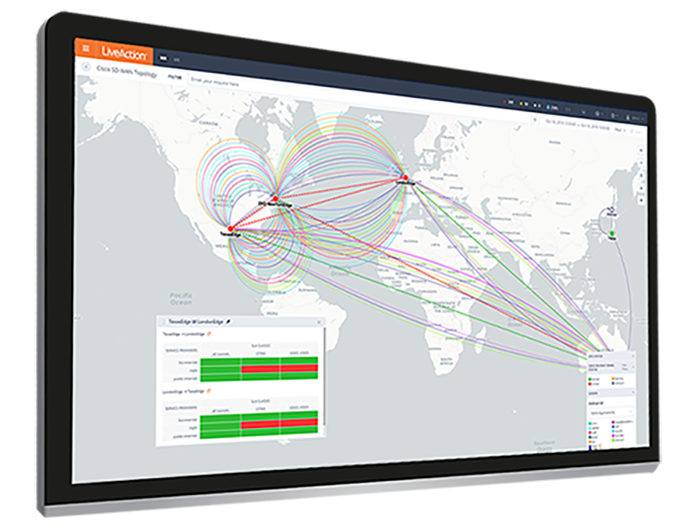
LiveNX是智能的,以行動為導向的軟體,提供即時可視化,深度監控,配置和思科和其他供應商的網絡設備的故障診斷,具有易於使用的圖形用戶界面。該系統由一個
輕量級的,而是高度可擴展的架構和多種技術模塊,每個模塊提供專門的軟體功能和特性集。
LiveNX provides a different approach to network management that combines extensive device knowledge with rich network
visualizations. The software captures the actual router and switch configurations to build a highly interactive “mental model” of the
network, enabling users to literally “see” flows, routes, and QoS policies operating in real time—across the network topology and deep inside each device.
The result is an incredibly true and relevant understanding of the network for fast and accurate
troubleshooting and highly informed decision making.
獲得對網絡性能的端到端可見性
多供應商,多結構,多雲端性能監控。
主動識別網絡問題
分析和警報使NetOps團隊立即意識到有意義的變化。
輕鬆排除故障並解決整個網絡中的問題
從多個數據源和API集成中快速準確地隔離問題,以進行工作流優化。
了解LiveAction如何解決您的網絡管理問題
網絡拓撲圖
您是否仍在使用靜態圖紙來了解與什麼有關?通過LiveNX拓撲圖,可以實時更新站點,設備,接口,應用程序,VPN和用戶,以獲取當前的網絡狀況視圖,以便快速排除問題並進行修復。
由於軟體定義環境引入了用於敏捷性和管理的結構覆蓋,NetOps需要一種可視化VPN,隧道和服務提供商傳輸的方法,以確保服務級別協議和關鍵性能指標(KPI)。
加速網絡事件解決方案
當您收到高嚴重性警報時,時鐘開始滴答作響。客戶無法訪問您的網站,在事件得到解決之前,公司可能每小時損失數千甚至數百萬美元。當時間就是金錢時,請查看LiveNX以獲得更快的問題隔離和解決方案。
借助業界領先的流量和數據包捕獲,分析和可視化,LiveNX可以主動通知NetOps不斷變化的情況,並提供優化的工作流程,以便深入了解整個組織的問題,深入了解根本原因和解決方案的數據包分析。
網絡報告
組織需要自定義和計劃報告,以向管理層提供狀態,關鍵性能指標,SLA問題,應用程序條件等。LiveNX可以輕鬆為您的組織選擇自定義儀表板,窗口小部件和報告。
從模板中選擇數據集或使用LiveNX創建自己的自定義視圖。靈活的報告選項為您提供所需的信息和見解,以便讓重要團隊了解並準確及時地處理報告。
功能
Configuration Features
– Full Modular QoS CLI (MQC) and Hierarchical Queuing Framework (HQF) configuration support
– Powerful editor engine for safely constructing a complex set of configuration changes offline, validating the correctness and utility of those changes, and then applying them to the remote device all at once
– Easy-to-use, full QoS editor
– Custom inbound and outbound QoS policy editor
– Graphical pie charts depicting bandwidth allocation among classes
– “Snapshot” capability for capturing current configurations
– Manual rollback feature to load previous snapshots into the device at any time
– Application and removal of QoS policies for multiple interfaces
– Ability to push QoS configurations to multiple devices easily
– Hierarchical policy creation for advanced configurations and WAN shaping
– Custom NBAR protocol definitions
– Unknown port identification and NBAR protocol match creation
– CLI command preview
– GRE tunnel QoS and visualization
– Pre-defined QoS policy templates based on Cisco and industry best practices
– Instant QoS policy creation using NBAR capabilities
Monitoring Features
– Rate-based NBAR graphs
– Pre- and post-QoS graphs
– QoS packet drop graph
– Interface-level packet drop graph
– Extreme low-level graphs of CBQoS statistics
– Built in CBQoS MIB viewer
– Ability to graph hierarchical policies
– Multi-day interactive baseline graphs
– Reporting capabilities
– Export data and screen capture capabilities
Troubleshooting Features
– QoS Audit capability across the network
– Unknown port discovery
– View QoS graphs across routers
– Topology-based QoS state indicator
LiveNX Flow Module
The LiveNX Flow technology module provides advanced system-level flow visualization, as well as internal router and interface flow
visualizations and graphs. For more details, refer to the chapter titled LiveNX Flow.
Features
– Topology-based flow view across multiple devices
– Supports Cisco NetFlow v5, v9 and flexible NetFlow, IPFIX, Juniper J-Flow, sFlow from various vendors including HewlettPackard, Alcatel-Lucent, and 3Com
– NetFlow views inside the router for tracing flows from ingress to egress
– Full reporting capabilities
– Flow based dashboards
– Flow filtering based on DSCP, port, source address, or destination address
– Flow tables with the ability to sort and select flows
– Detailed information on individual flows
– Works in NetFlow MIB and Collector modes
– Ability to start and stop NetFlow data on a per-device basis
– Flow graph per interface based on destination or source address, DSCP, or port
– Ability to resolve IP addresses to hostname
Benefits
– Faster troubleshooting of the network
– Ability to view flows across the network
– Ability to pinpoint entry and exit of flows
– Improved visibility and understanding of the flows
– Observe the effects of routing and PBR, such as route updates and asymmetric routing
LiveNX Routing Module
The LiveNX Routing technology module provides real-time routing-layer visualizations for Cisco networks. In addition, the module’s
policy-based routing feature provides a high degree of control, allowing users to route traffic easily and predictably over userspecified paths. For more details, refer to the Chapter 8 LiveNX Routing.
Features
– System-level topology view of active routes
– Displays by protocol, directionality, and destination
– Mouse-over displays individual route statistics
– Next-Hop Routing visualization
– OSPF and EIGRP neighbor adjacency
– Device route-table views in graphical and tabular form
– Shows destinations for interface
– Displays all entries or filtered entries only
– Route display filtering by protocol
– Filters by direct and static routes
– Filters EIGRP, OSPF, BGP, and RIP protocols
– Filters per user and periodic downloaded static routes
– Other filters: IS-IS, mobile, on demand, IGRP, EGP
– Route display filtering by destination
– Shows default route
– Shows routes to destination IP address
– Shows routes to destination network
– Export function
– Exports route and route table information for further analysis
– Exports forwarding tables to CSV file (by device)
– Refresh real-time updates of routing layer—refreshes all routes or specified routes only
– Troubleshooting capabilities
– Displays routing loops and asymmetric routes
– Alerts to routing instabilities
– Detects black holes
– Provides error summarization
– Policy-based routing (PBR)
– Configuration and editing of PBR and Set statements
– Editing of existing route map configurations
– Validates user entries to ensure PBR compliance
– Displays indicate where PBR is applied
Chapter 1 |Overview http://liveaction.com 1-4
– Exports route map statistics
– Displays static routes and PBR issues
– Virtual Routing and Forwarding (VRF) visualization
– Displays virtual routing and forwarding tables
– Exports VRF tables to CSV file
LiveNX IP SLA Module
The LiveNX IP SLA technology module makes Cisco IOS IP service level agreement (SLA) operations easily accessible for generating
synthetic network traffic to monitor latency, loss, jitter, and mean opinion score (MOS) for VoIP. For more details, refer to the
chapter titled LiveNX IP SLA.
Features
– Latency, loss, jitter, and MOS performance measurements
– System wide IPSLA hub and spoke and mesh configurations
– Test types: DHCP, DNS, FTP, HTTP, ICMP Echo, Jitter, Path Echo, Path Jitter, UDP Echo
– Traffic type configuration
– Protocol type: more than 10 protocol types
– DHCP: destination, source, circuit ID, remote ID, subnet mask
– Test frequency setting
– Jitter test parameters—VoIP codec simulation (G.711 ulaw, G.711 alaw, G.729a)
– Mode: active or passive
– Packet priority: normal or high
– Precision: in microseconds or milliseconds
– IP SLA topology view (real time)
– Multiple colors for visualization
– Loss indicators
– Normal and above-threshold indicators
– Lists of running tests (indicating source, type, status)
– Quick and full test options
– Set up responder at destination
– Start/Stop traffic tests
– Edit, save, or delete test configurations
– Export results to CSV file
– Historical reporting (live update averages over timeline)
– Variable sampling rates: from 10 seconds to 5 minutes
– Latency: milliseconds over time, microseconds for jitter
– Loss: number of dropped packets
– VoIP MOS range: 1-5
LiveNX LAN Module
The LiveNX LAN technology module provides real-time Layer 2 visualizations for networks, including trunk interfaces, port channels,
VLAN associations and bandwidth percentages. For more details, refer to the chapter titled LiveNX LAN.
Features
– Network Visualization
– Automatic device discovery
– VLAN trunk, port channel names
– VLAN associations within a device
– VLAN highlighting through a network
– Input/Output bandwidth of each VLAN and port interface
– Real-Time Monitoring
– Trunk and access bandwidth information through network polling
– Layer 2 QoS statistics including CoS, DSCP and IP precedence
– Dropped packets, interface warnings through network polling at the VLAN level
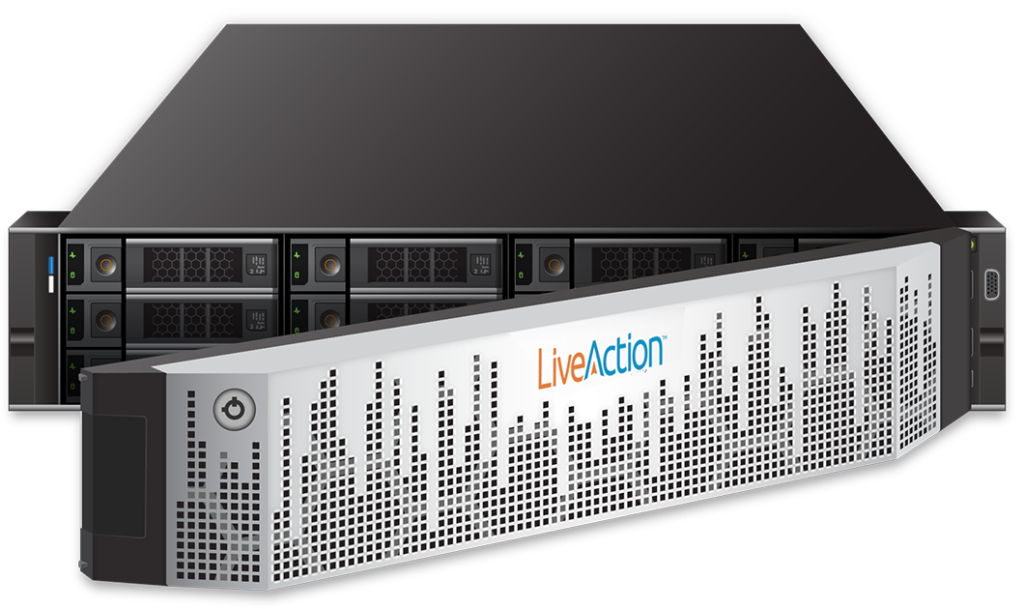
LiveCapture (原名 Omnipliance)
用於網絡監控的高性能數據包捕獲和應用程序級問題的故障排除
LiveCapture高性能數據包捕獲設備針對Omnipeek進行了優化,可擴展網絡監控和可視性,以便對遠程站點和分支機構,WAN鏈路和數據中心的應用程序級問題進行故障排除。
優化遠程網絡的性能
快速排除故障並解決分支機構,WAN鏈路和數據中心的不良應用程式性能問題。
分支機構,WAN鏈路和數據中心的數據包捕獲
在分支機構,WAN鏈路和數據中心捕獲數據包
LiveCapture產品允許您從分支機構,遠程位置,WAN鏈接和數據中心捕獲數據包數據。
Omnipeek無縫分析
LiveCapture 1K和3K與Omnipeek無縫集成,實現一流的協議分析。
優化應用程式性能
使用深度取證分析,輕鬆快速地捕獲數據包以對VoIP和視頻等應用程序進行故障排除。
使用Omnipeek實現快速問題隔離的分佈式數據包捕獲
LiveCapture與Omnipeek無縫集成,可在分支機構,WAN鏈路和數據中心進行一流的數據包分析。
LiveCapture 1K - 分支機構和SMB的數據包捕獲
LiveCapture 1K是LiveAction最經濟實惠的數據包捕獲和分析設備,是在要求不高的1G和10G網絡上進行數據包監控,可視化和分析的理想解決方案。
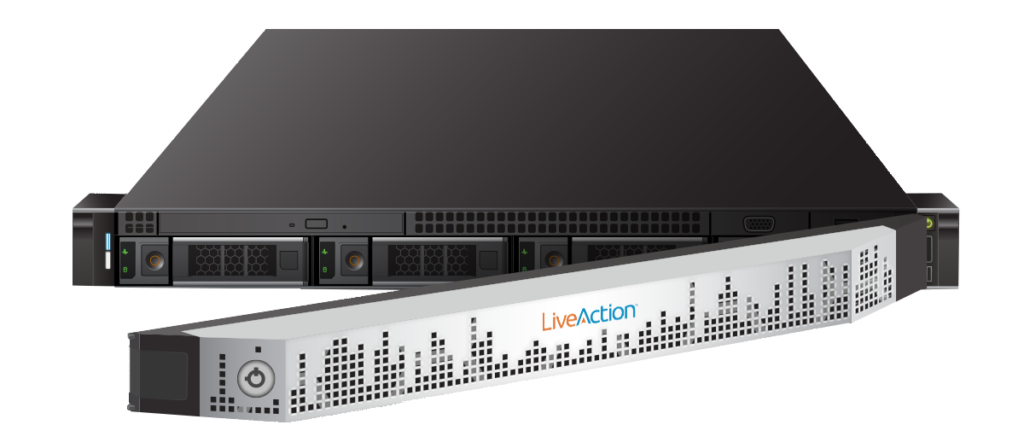
LiveCapture 3K - 數據中心,NOC和WAN鏈路的數據包捕獲
LiveCapture 3K具有強大的網絡記錄功能,可捕獲數TB的流量,屢獲殊榮的Capture Engine軟件可對實時網絡流量進行實時分析,並對記錄的流量進行取證網絡分析。LiveCapture 3K設計用於捕獲和分析高達100G的要求更高的網絡的流量。
使用Omnipeek簡化故障排除
LiveCapture 1K和3K均可與Omnipeek無縫集成,以簡化應用程序問題的故障排除和根本原因分析。
將LiveCapture擴展為無線分析器
除了分析有線數據包流量外,LiveCapture還可用作WLAN分析解決方案,使您能夠監控,分析,存儲和診斷數千兆位速度的無線流量。
法醫分析的歷史回顧
LiveCapture允許進行實時數據包分析和歷史回放以進行取證分析。
確保對生產流量性能的零影響
通過使用網絡分流器鏡像流量,LiveCapture 1K和3K產品可監控分組數據,而不會影響生產網絡流量的性能。
多用戶調查
通過與Omnipeek無縫集成Web,LiveCapture允許無限數量的用戶使用我們著名的Omnipeek協議分析軟件進行深度取證分析。
產品比較
| LiveCapture 1100 | LiveCapture 3100 |
 |
 |
|
LiveCapture 1K是LiveAction最經濟實惠的數據包捕獲和 LIVECAPTURE 1K功能
|
LiveCapture 3K具有強大的網絡記錄功能,可捕獲數TB LIVECAPTURE 3K功能
|
Omnipliance Micro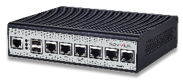
The full Savvius stack in a 1 TB box for distributed offices or the network edge.
Specifications
Interfaces: 1G
SSD: 256 GB or 1TB
Bridge ports (“fail to wire”)
ELK server and dashboards included
LiveWire (原名 Insight / Micro)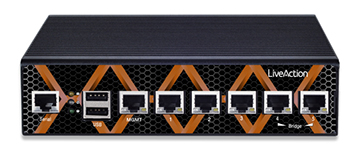
通過數據包 捕獲和 深度數據包 分析擴展可見性
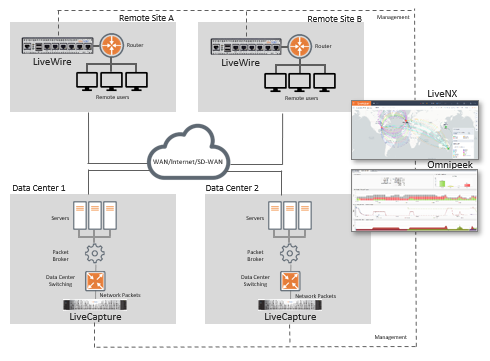
從幾乎任何地方捕獲數據包數據
LiveWire產品允許您從網絡中的幾乎任何位置捕獲數據包數據,並使用LiveNX平台進行分析。
在遠程站點,WAN邊緣和數據中心實現可見性
擴展對遠程站點,分支機構,WAN邊緣,LAN和數據中心的網絡監控和可視性。
優化應用程式性能
使用NetFlow和深度取證分析,輕鬆快速地對包括VoIP和視頻在內的應用程式進行故障排除。
推薦用途
Remote Office Networks
• Deploy the industry’s first affordable networkmonitoring and diagnostics solution for remote offices
• Collect key network performance indicators and display the results in your web browser
• Eliminate travel to remote locations for network troubleshooting
Managed Service Providers
• Provide services to more customers with the same staff
• Offer new and differentiated service offerings
• Respond to customer issues instantaneously from any location
Small Businesses
• Understand your network performance through intuitive, web-based dashboards
• Make key network trouble-shooting data available to remote network professionals
• Install and configure LiveWire in less than 5 minutes
| LiveWire Edge | LiveWire Core | LiveWire PowerCore | |
| LiveWire Devices | |||
| Use Cases | Small branches and remote sites. WAN edge. | Large branches. Data centers. WAN edge. | Very large branches. Data centers. WAN. LAN. |
| Integration into LiveNX Platform | Up to 160 Mbps | Up to 3 Gbps | Up to 10 Gbps |
| Forensic Capture (CTD) | Up to 850 Mbps | Up to 4 Gbps | Up to 20 Gbps |
| Memory | 16 GB | 32 GB | 192 GB |
| Storage Capacity | 1 TB SSD | 16 TB | 64 TB |
| Device dimensions / Weight | 7-by-1.7-by-5.7-inches: 2.64 lbs | 1U, 39 lb. | 2U, 73 lb. |
| IncludesOmnipeek for Windows Packet Analysis | Yes (1 license) | Yes (1 license) | Yes (1 license) |
| Volp, Video and UC Analysis | Yes | Yes | Yes |