最新版 Statgraphics 19.6.03 更新於 2024/1/25

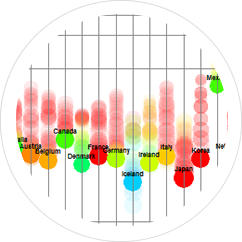
資料視覺化
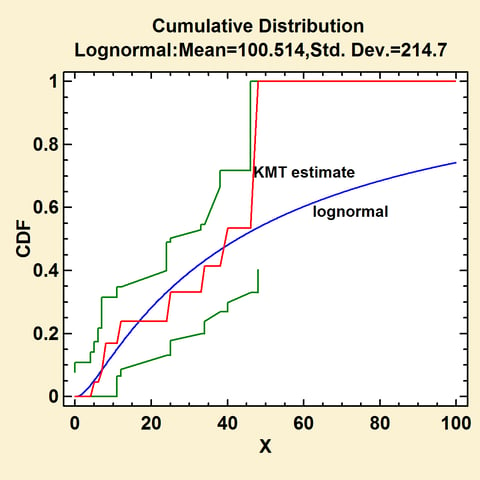
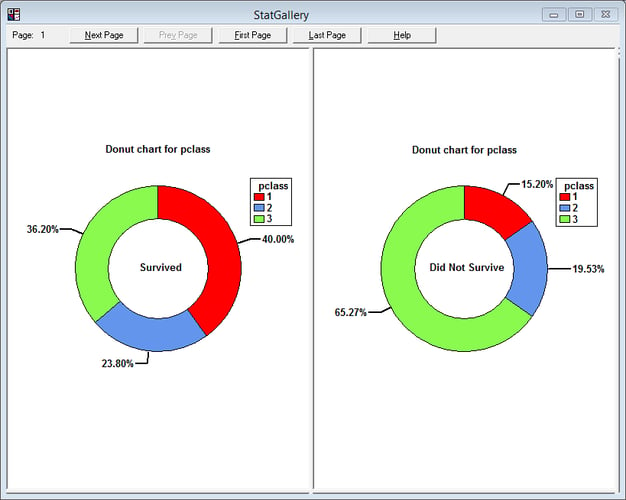
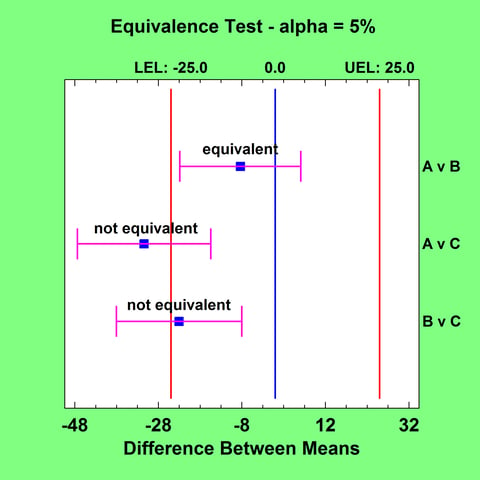
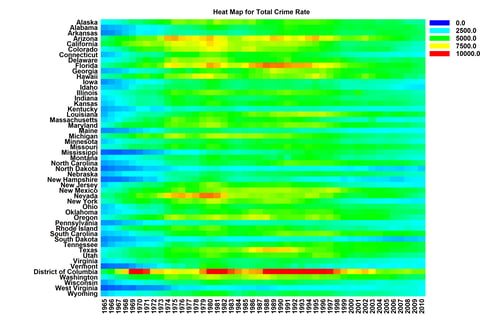
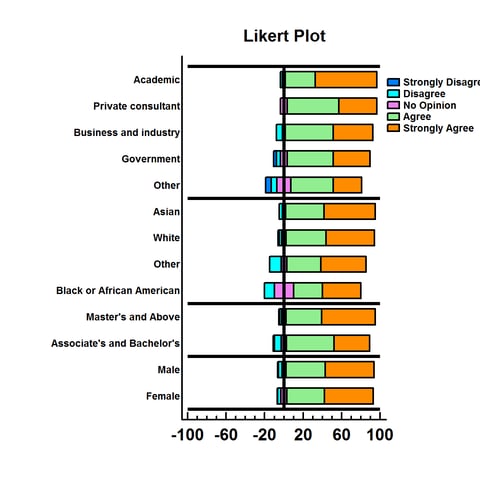
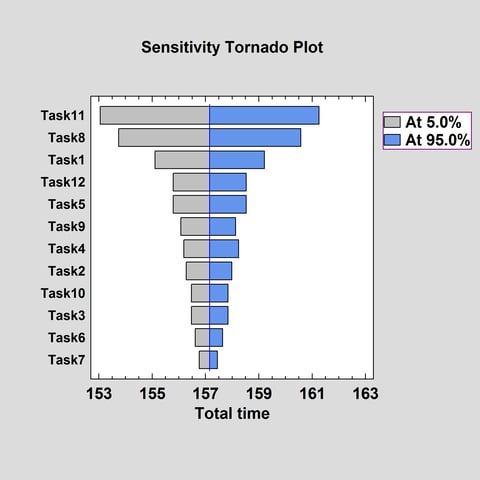
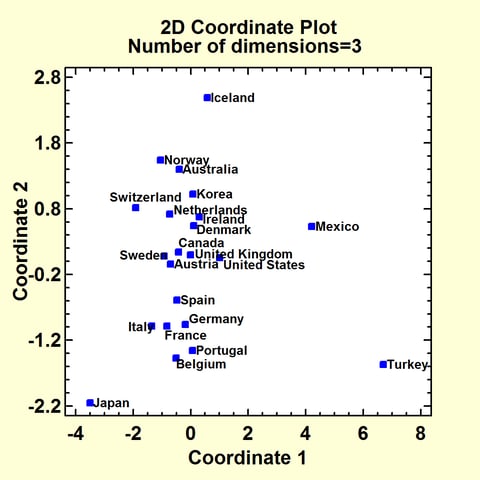
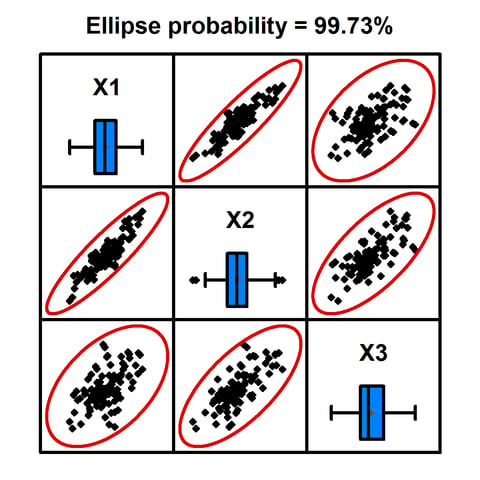
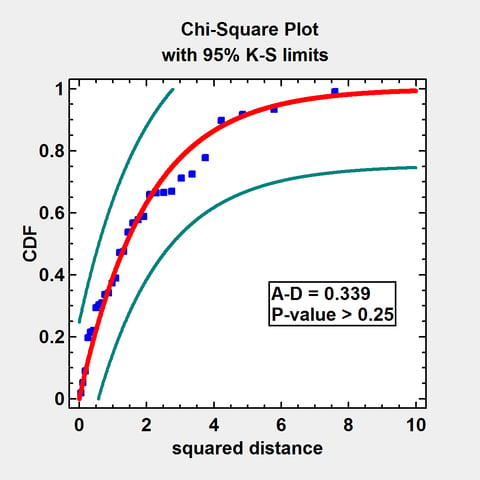
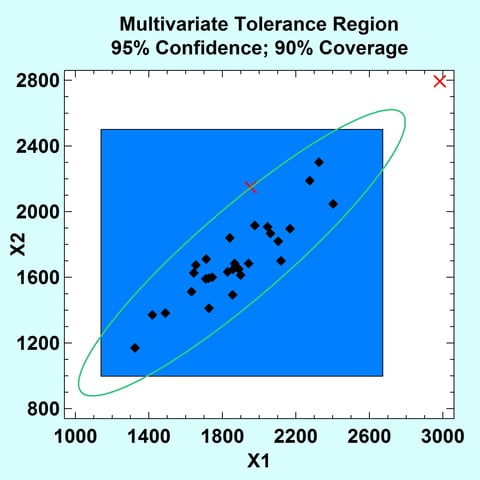
以宏觀的視角看您的資料。 藉由調整工具列上的控制選項,可觀察資料隨時間的變化。優異的繪圖機能,讓所有資訊無所遁形!
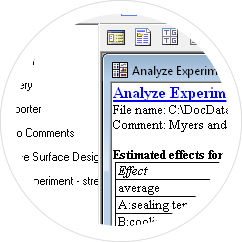
容易使用
Statgraphics 將複雜的資料轉變成簡單的語言、清晰的結果。使用者不需熟讀統計學,也可藉著分析精靈,專業而科學的解讀資料。
USER INTERFACE
1. Dashboard – displays tables and graphs from multiple analyses with red/yellow/ green alerts.
2. DataBook – new sort options to reverse order of rows plus expanded Undo.
3. Data import – direct data import from Minitab project files, SAS transport files, and SPSS portable files.
4. Optional single pane view in analysis windows – report-style layout for tables and graphs.
5. Python interface – data exchange and execution of Python scripts.
6. Quick access toolbar – one-click access to common operations and analyses.
7. Ribbon bar – replaces old menu and analysis toolbar.
8. StatGallery – may now save graphs in image files.
9. Tabbed dialog boxes – new layout simplifies setting options.
10. Tooltips on popup menus – important aid for new users.
GRAPHICS AND DATA VISUALIZATION
1. Barcharts with added lines – to display second variable.
2. Dendrograms – optional lines to separate clusters.
3. Missing data plot – for visualizing location of missing values in a datasheet.
4. Paired sample comparison – new diagonal and difference plots.
5. Point drill-down – expanded information when clicking on a point.
6. Transparent background – may specify transparent background when copying images.
7. Venn and Euler diagrams – for visualizing overlap of sets.
8. Waterfall plots – for displaying ordered, sequential and 3-dimensional data.
DESIGN OF EXPERIMENTS AND STATISTICAL PROCESS CONTROL
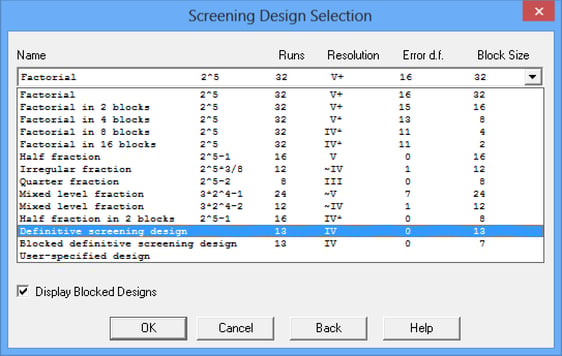
1. Alias optimal designs – construction of experiments that maximize design efficiency while minimizing aliasing.
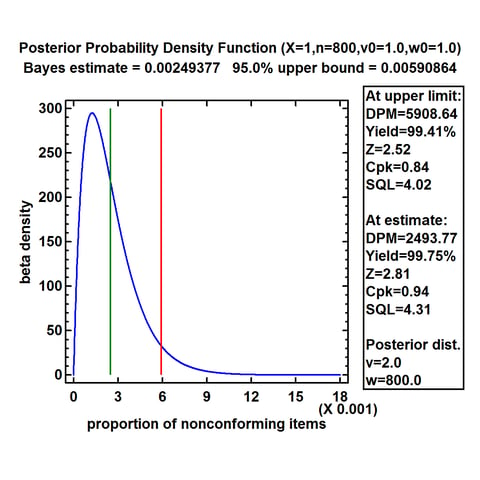
2. Attribute capability analysis – conformance analysis and Cpc statistic.
3. Gage R&R using GLM – allows unbalanced data and additional sources of variability.
4. Optimal augmentation of existing designs – computer generated runs added to existing designs so as to maximize design efficiency.
5. Optimization – may now select which responses to optimize in DOE Wizard.
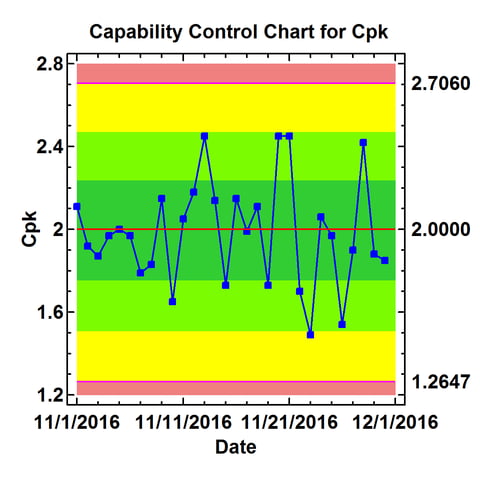
6. Recalculation points – control limits and capability indices may be recalculated at 9 locations.
REGRESSION AND ANALYSIS OF VARIANCE
1. Calibration models – estimation of one-sided prediction limits.
2. General linear models – stepwise factor selection and easier entry of interactions.
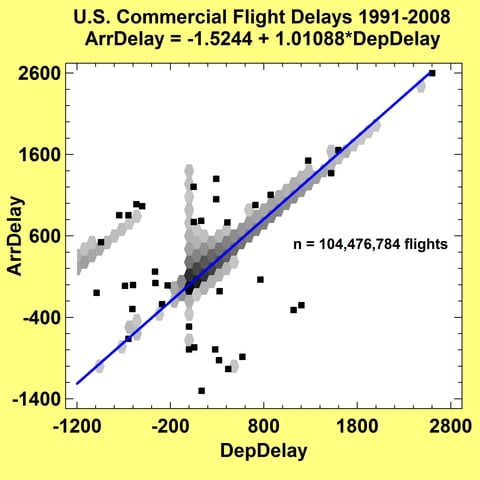
3. Piecewise linear regression – fitting models with multiple linear segments.
4. Quantile regression – models for predicting response variable quantiles.
5. Residual probability plots – added to several procedures.
6. Stability studies – estimation of shelf life from multiple batches.
7. Variance components analysis – new contribution plot shows contribution of each component.
8. Zero-inflated count regression – Poisson and negative binomial regression models with extra structural zeroes.
DISTRIBUTION FITTING
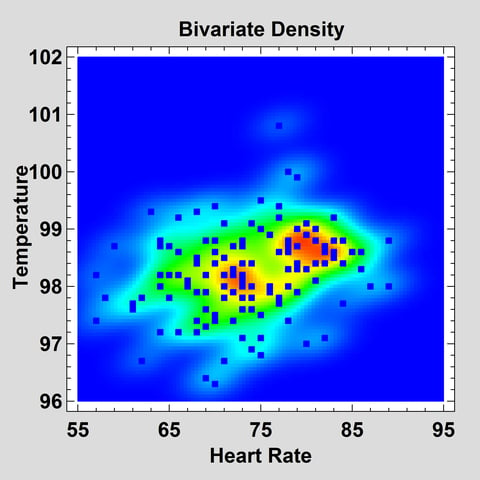
1. Bivariate mixture distributions – mixtures of 2 or more bivariate normal distributions.
2. Johnson distributions – fitting and random numbers for SB, SL and SU distributions.
3. Univariate mixture distributions – mixtures of 2 or more univariate normal distributions.
4. Zero-inflated Poisson and negative binomial distributions – fitting and simulation.
MACHINE LEARING
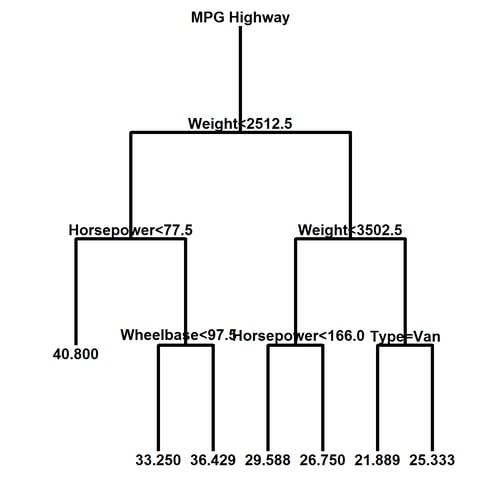
1. Decision forests – construction of classification and regression models based on, multiple decision trees.
2. K-means clustering – grouping of observations based on variable similarities.
STATISTICAL TESTS
1. Equivalence and noninferiority tests for variances – comparing 2 variances and comparing variance to target.
2. Mann-Kendall test – test for monotonic trend in a time series.
3. Modified Levene’s test – test for homogeneity of variances in oneway ANOVA.
4. Wald-Wolfowitz test – nonparametric comparison of two samples.
 |
 |
 |
 |
 |
 |
 |
 |
 |
 |
 |
 |
 |
 |
 |
 |
 |
 |
 |
 |
• Windows XP, Vista, 7, 8, 10 or later
• 32-bit Systems: 1 GB minimum, 2 GB or more recommended; 64-bit systems:4 GB or more recommended
• 320MB or greater of available disk storage
• CD-ROM drive or access to Internet
| Product | Target Audience | Type of product | License types |
| Statgraphics Centurion | Data analysts desiring a wide range of statistical tools | Standalone Windows application | Single-user perpetual |
| Single-user annual | |||
| Multi-user perpetual | |||
| Multi-user annual | |||
| Enterprise annual | |||
| Academic enterprise annual | |||
| Statgraphics sigma express | Six Sigma practitioners needing statistical functions for quality improvement | Excel add-in | Single-user perpetual |
| Enterprise annual | |||
| Academic enterprise annual | |||
| Statgraphics stratus | Data analysts desiring statistical functionality within a web browser | Web application | Single-user monthly |
| Server annual | |||
| Statgraphics Web Services | Web application developers | Web service | Server annual |
| Statbeans | JAVA application developers | Statistical library | Server annual |
