最新版 Risk Simulator 2017
.png)
Real Options Valuation
是一家專注於決策和風險管理的咨詢公司。我們提供決策和風險管理的技術和工具,如實物期權分析、蒙特卡洛仿真、預測、優化以及風險建模。我們的產品 Risk Simulator,是一個集風險分析、仿真、預測和優化於一體的軟體
►蒙特卡洛仿真
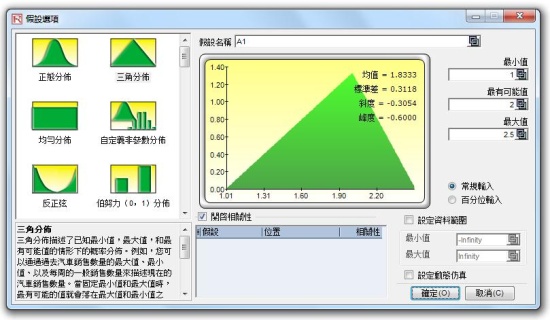
45種概率分布函數,簡易使用界面,高速仿真運行 (千次/秒),Copulas、拉丁超立方和蒙特卡洛模擬
►分析工具
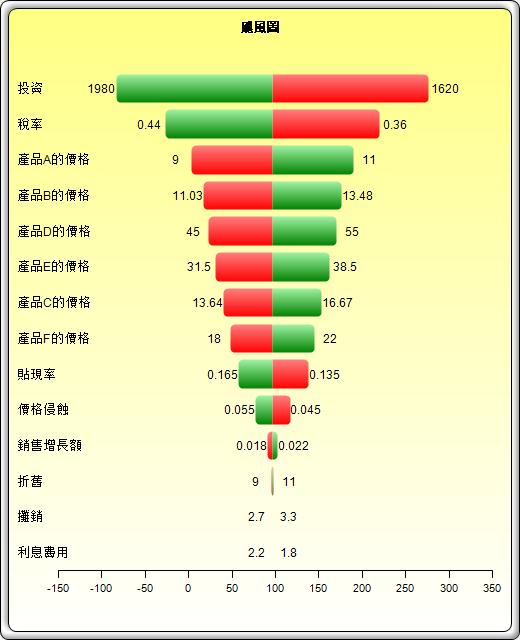
自舉法,模型檢查、聚類分割、綜合報告、數據提取和統計報告、數據導入、去季節因素和去趨勢化、數據診斷、分布選擇 (一元、多元、Percentile Fit)、分布概率 (PDF、CDF、ICDF)、假設檢驗、覆蓋率、主成分分析、敏感性分析、情景分析、統計分析、結構突變、颶風圖和蛛網圖 spider charts
►預測
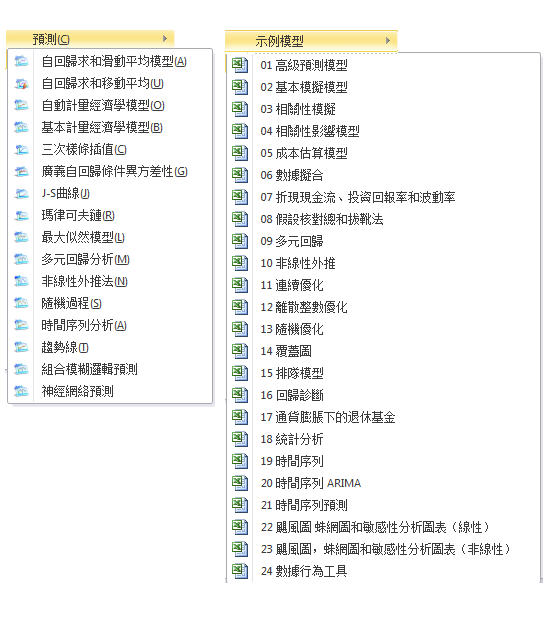
Box-Jenkins ARIMA、Auto ARIMA、基礎計量經濟學、自動計量經濟學、組合模糊邏輯 Combinatorial Fuzzy Logic,三次樣條法、自定義分布、GARCH 模型、J 曲線、S 曲線、馬爾科夫鏈、極大似然法、多元回歸、神經網絡、非線性外推、隨機過程、時間序列分解、趨勢線
►優化
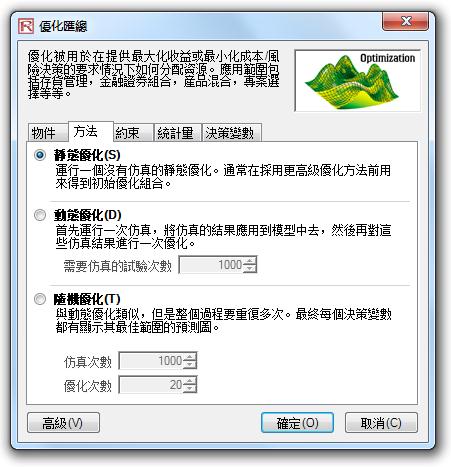
連續、離散、整數變量的靜態優化、動態優化和隨機優化、有效前沿、 遺傳算法、線性非線性優化、單變量目標搜索
RISK SIMULATOR DETAILS
RISK SIMULATOR是一款功能強大的Excel插件軟體,用於在現有的Excel電子表格模型中應用模擬,預測,統計分析和優化。該軟體專門開發,非常易於使用。例如,運行風險模擬就像1-2-3一樣簡單,設置輸入,設置輸出和運行。執行預測可以輕鬆地點擊兩到三次鼠標,軟件會自動為您完成所有操作,並提供詳細的報告,強大的圖表和數位結果。它甚至還有英語,西班牙語,中文和日語,還有其他語言。
Risk Simulator還與我們的其他軟體集成,包括Real Options Super Lattice Solver,Employee Stock Options Valuation Toolkit,Modeling Toolkit(超過800個功能和300個型號),ROV Modeler,ROV Optimizer,ROV Valuator,ROV Basel II Modeler,ROV Compiler ,ROV提取器和評估器,以及ROV儀表板。
New Advanced Methods and Models:
- GARCH Models: GARCH, GARCH-M, TGARCH-M, TGARCH, EGARCH, EGARCH-T, GJR GARCH, GJR TGARCH
- MLE-LIMDEP (Maximum Likelihood Estimation for Limited Dependent Variables): Logit, Probit, Tobit
- Data Deseasonalization
- Data Detrending and Cyclicality Analysis
- Principal Component Analysis
- Structural Break Analysis
- Checking model integrity
- Trendline Forecasts (linear, nonlinear polynomial, power, logarithmic, exponential, moving average)
- Stepwise Multiple Regression (forward, backward, correlation, forward-backward)
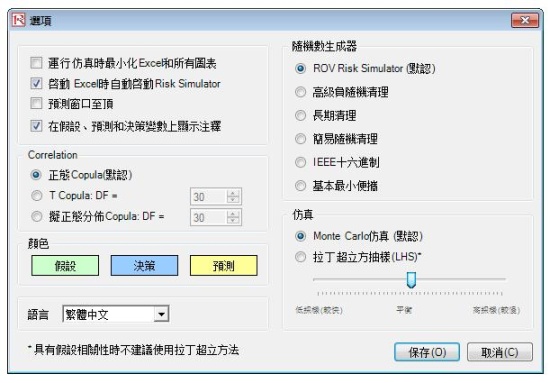
- T-Copulas and Quasi-Normal Copula, Normal Copula for correlated simulations
- 6 Random Number Generators:
- ROV Advanced Subtractive Generator
- Subtractive Random Shuffle Generator
- Long Period Shuffle Generator
- Portable Random Shuffle Generator
- Quick IEEE Hex Generator
- Basic Minimal Portable Generator
- Latin Hypercube Sampling (complements existing Monte Carlo Simulation)
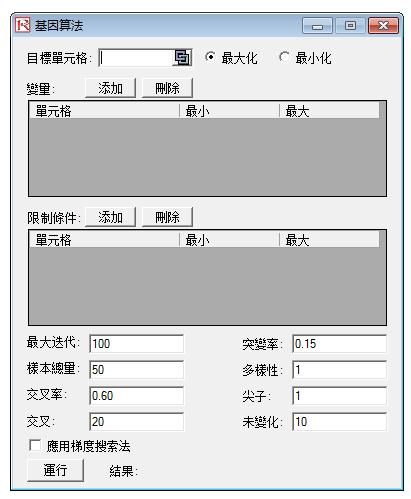
- Genetic Algorithm in optimization
- Single Variable Goal Seek
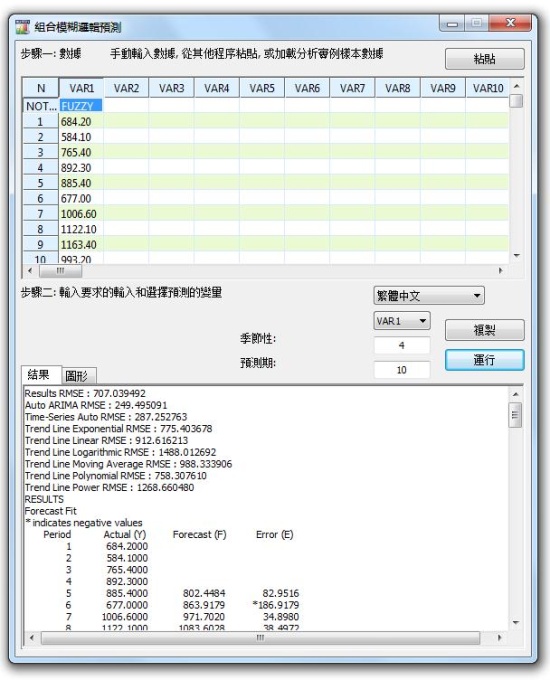
- Combinatorial Fuzzy Logic Forecasts
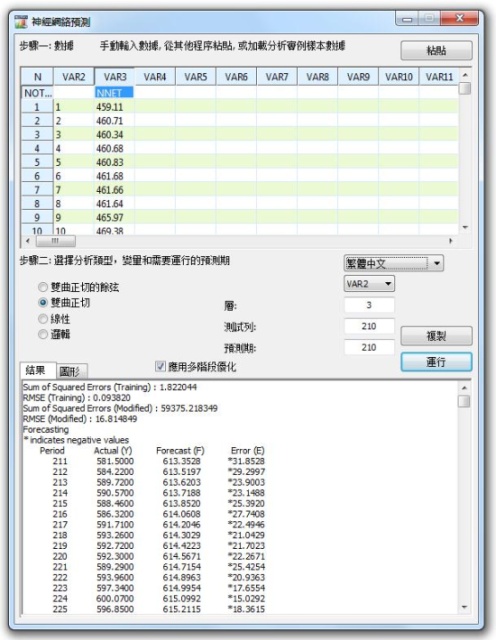
- Neural Network Forecasts (linear, nonlinear logistic, hyperbolic tangent, and cosine)
ROV Decision Tree:
ROV Decision Tree is used to create and value decision tree models. Additional advanced methodologies and analytics are also included: Decision Tree Models, Monte Carlo Risk Simulation, Sensitivity Analysis, Scenario Analysis, Bayesian (Joint and Posterior Probability Updating), Expected Value of Information, MINIMAX, MAXIMIN, Risk Profiles.
Percentile Distributional Fitting:
uses percentiles and optimization to find the best-fitting distribution.
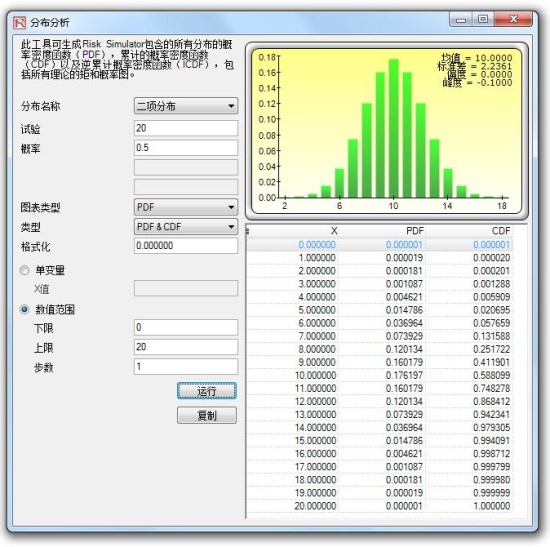
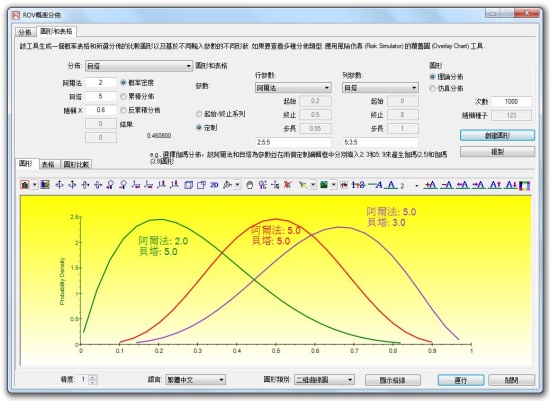
Probability Distributions’ Charts and Tables:
runs 45 probability distributions, their four moments, CDF, ICDF, PDF, charts, and overlay multiple distributional charts, and generates probability distribution tables.
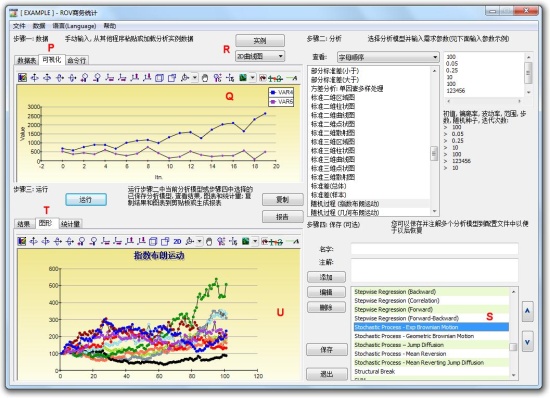
ROV BizStats:
A new module called ROV BizStats, which is a standalone tool that can be used to run basic to advanced statistical analyses at very high speeds. This new module includes the following 265+ methods:
AI Machine Learning: Bagging Linear Fit Bootstrap Aggregation (Supervised), AI Machine Learning: Bagging Nonlinear Fit Bootstrap Aggregation (Supervised), AI Machine Learning: Classification Regression Trees CART (Supervised), AI Machine Learning: Classification with Gaussian Mix & K-Means (Unsupervised), AI Machine Learning: Classification with Gaussian SVM (Supervised), AI Machine Learning: Classification with K-Nearest Neighbor (Supervised), AI Machine Learning: Classification with Phylogenetic Tree & Hierarchical Clustering (Unsupervised), AI Machine Learning: Classification with Linear SVM (Supervised), AI Machine Learning: Classification with Polynomial SVM (Supervised), AI Machine Learning: Custom Fit Model (Supervised), AI Machine Learning: Dimension Reduction Factor Analysis (Unsupervised), AI Machine Learning: Dimension Reduction Principal Component Analysis (PCA), AI Machine Learning: Ensemble Common Fit (Supervised), AI Machine Learning: Ensemble Common Fit (Supervised), AI Machine Learning: Ensemble Time-Series (Supervised), AI Machine Learning: Linear Fit Model (Supervised), AI Machine Learning: Logistic Binary Classification (Supervised), AI Machine Learning: Multivariate Discriminant Analysis (Linear) (Supervised), AI Machine Learning: Multivariate Discriminant Analysis (Quadratic) (Supervised), AI Machine Learning: Neural Network (Cosine Hyperbolic Tangent), AI Machine Learning: Neural Network (Hyperbolic Tangent) (Supervised), AI Machine Learning: Neural Network (Linear) (Supervised), AI Machine Learning: Neural Network (Logistic) (Supervised), AI Machine Learning: Normit Probit Binary Classification (Supervised), AI Machine Learning: Random Forest (Supervised), AI Machine Learning: Segmentation Clustering (Unsupervised), ANCOVA (Single Factor Multiple Treatments), ANOVA (MANOVA General Linear Model), ANOVA (Randomized Blocks Multiple Treatments), ANOVA (Single Factor Multiple Treatments), ANOVA (Single Factor Repeated Measures), ANOVA (Two-Way Analysis), ANOVA (Two-Way MANOVA General Linear Model), ARIMA, ARIMA Seasonal (SARIMA), Auto ARIMA, Auto Econometrics (Detailed), Auto Econometrics (Quick), Autocorrelation and Partial Autocorrelation, Autocorrelation Durbin-Watson AR(1) Test, Bonferroni Test (Single Variable with Repetition), Bonferroni Test (Two Variables with Repetition), Box–Cox Normal Transformation, Box’s Test for Homogeneity of Covariance, Charts: 2D Area, Charts: 2D Bar, Charts: 2D Column, Charts: 2D Line, Charts: 2D Pareto, Charts: 2D Point, Charts: 2D Scatter, Charts: 3 Variables Bubble, Charts: 3D Area, Charts: 3D Bar, Charts: 3D Column, Charts: 3D Line, Charts: 3D Pareto, Charts: 3D Point, Charts: 3D Scatter, Charts: Box-Whisker, Charts: Fan Chart, Charts: Q-Q Normal, Coefficient of Variation Homogeneity Test, Cointegration Test (Engle-Granger), Combinatorial Fuzzy Logic, Control Chart: C, Control Chart: NP, Control Chart: P, Control Chart: R, Control Chart: U, Control Chart: X, Control Chart: XMR, Convolution Simulation: Discrete Normal with Lognormal Arithmetic Scale , Convolution Simulation Discrete Normal Lognormal Logarithmic Scale, Convolution Simulation Poisson Frechet, Convolution Simulation Poisson Gumbel Max, Convolution Simulation Poisson Lognormal Arithmetic Scale, Convolution Simulation Poisson Lognormal Log Scale, Convolution Simulation Poisson Normal, Convolution Simulation Poisson Pareto, Convolution Simulation Poisson Weibull , Correlation Matrix (Linear, Nonlinear), Covariance Matrix, Cox Regression, Cubic Spline, Custom Econometric Model, Data Analysis: Cross Tabulation, Data Analysis: New Values Only, Data Analysis: Pivot Table, Data Analysis: Subtotal by Category, Data Analysis: Unique Values Only, Data Descriptive Statistics, Deseasonalize, Discriminate Analysis (Linear), Discriminate Analysis (Quadratic), Distributional Fitting: ALL: Continuous, Distributional Fitting: Continuous (Akaike Information Criterion), Distributional Fitting: Continuous (Anderson–Darling), Distributional Fitting: Continuous (Kolmogorov–Smirnov), Distributional Fitting: Continuous (Kuiper’s Statistic), Distributional Fitting: Continuous (Schwarz/Bayes Criterion), Distributional Fitting: Discrete (Chi-Square), Diversity Index (Shannon, Brillouin, Simpson), Eigenvalues and Eigenvectors, Endogeneity Test with Two Stage Least Squares (Durbin-Wu-Hausman), Endogenous Model (Instrumental Variables with Two Stage Least Squares), Error Correction Model (Engle-Granger), Exponential J-Curve, Factor Analysis (PCA with Varimax Rotation), Forecast Accuracy (All Goodness of Fit Measures), Forecast Accuracy: Akaike, Bayes, Schwarz, MAD, MSE, RMSE, Forecast Accuracy: Diebold–Mariano (Dual Competing Forecasts), Forecast Accuracy: Pesaran–Timmermann (Single Directional Forecast), Generalized Linear Models (Logit with Binary Outcomes), Generalized Linear Models (Logit with Bivariate Outcomes), Generalized Linear Models (Probit with Binary Outcomes), Generalized Linear Models (Probit with Bivariate Outcomes), Generalized Linear Models (Tobit with Censored Data), Granger Causality, Grubbs Test for Outliers, Heteroskedasticity Test (Breusch–Pagan–Godfrey), Heteroskedasticity Test (Lagrange Multiplier), Heteroskedasticity Test (Wald–Glejser), Heteroskedasticity Test (Wald’s on Individual Variables), Hodrick-Prescott Filter, Hotelling T-Square: 1 VAR with Related Measures, Hotelling T-Square: 2 VAR Dependent Pair with Related Measures, Hotelling T-Square: 2 VAR Indep. Equal Variance with Related Measures, Hotelling T-Square: 2 VAR Indep. Unequal Variance with Related Measures, Internal Consistency Reliability: Cronbach’s Alpha (Dichotomous Data), Internal Consistency Reliability: Guttman’s Lambda and Split Half Model, Inter-rater Reliability: Cohen’s Kappa, Inter-rater Reliability: Inter-Class Correlation (ICC), Inter-rater Reliability: Kendall’s W (No Ties), Inter-rater Reliability: Kendall’s W (with Ties), Inter-rater Reliability: Kuder Richardson, Kendall’s Tau Correlation (No Ties), Kendall’s Tau Correlation (with Ties), Linear Interpolation, Logistic S-Curve, Mahalanobis Distance, Markov Chain, Markov Chain Transition Risk Matrix, Multiple Poisson Regression (Population and Frequency), Multiple Regression (Deming Regression with Known Variance), Multiple Regression (Linear), Multiple Regression (Nonlinear), Multiple Regression (Ordinal Logistic Regression), Multiple Regression (Through Origin), Multiple Regression (Two-Variable Functional Form Tests), Multiple Ridge Regression (Low Variance, High Bias, High VIF), Multiple Weighted Regression (Fixing Heteroskedasticity), Nominal Data Contingency Analysis (McNemar’s Marginal Homogeneity), Nonparametric: Chi-Square GOF for Normality (Grouped Data), Nonparametric: Chi-Square Independence, Nonparametric: Chi-Square Population Variance, Nonparametric: Cochran’s Q (Binary Repeated Measures), Nonparametric: D’Agostino–Pearson Normality Test, Nonparametric: Friedman’s Test, Nonparametric: Kruskal–Wallis Test, Nonparametric: Lilliefors Test for Normality, Nonparametric: Mann–Whitney Test (Two Var), Nonparametric: Mood’s Multivariate Median Test, Nonparametric: Runs Test for Randomness, Nonparametric: Shapiro–Wilk–Royston Normality Test, Nonparametric: Wilcoxon Signed-Rank Test (One Var), Nonparametric: Wilcoxon Signed-Rank Test (Two Var), Parametric: One Variable (T) Mean, Parametric: One Variable (Z) Mean, Parametric: One Variable (Z) Proportion, Parametric: Power Curve for T-Test, Parametric: Two Variable (F) Variances, Parametric: Two Variable (T) Dependent Mean, Parametric: Two Variable (T) Independent Equal Variances, Parametric: Two Variable (T) Independent Unequal Variances, Parametric: Two Variable (Z) Independent Means, Parametric: Two Variable (Z) Independent Proportions, Partial Correlations (Using Correlation Matrix), Partial Correlations (Using Raw Data), Principal Component Analysis, Process Capability (CPK, PPK), Quick Statistic: Absolute Values (ABS), Quick Statistic: Average (AVG), Quick Statistic: Count, Quick Statistic: Difference, Quick Statistic: LAG, Quick Statistic: Lead, Quick Statistic: LN, Quick Statistic: LOG, Quick Statistic: Max, Quick Statistic: Median, Quick Statistic: Min, Quick Statistic: Mode, Quick Statistic: Power, Quick Statistic: Rank Ascending, Quick Statistic: Rank Descending, Quick Statistic: Relative LN Returns, Quick Statistic: Relative Returns, Quick Statistic: Semi-Standard Deviation (Lower), Quick Statistic: Semi-Standard Deviation (Upper), Quick Statistic: Standard Deviation Population, Quick Statistic: Standard Deviation Sample, Quick Statistic: Sum, Quick Statistic: Variance (Population), Quick Statistic: Variance (Sample), ROC Curves, AUC, and Classification Tables, Seasonality, Segmentation Clustering, Skew and Kurtosis: Shapiro–Wilk and D’Agostino–Pearson, Specifications Cubed Test (Ramsey’s RESET), Specifications Squared Test (Ramsey’s RESET), Stationarity: Augmented Dickey-Fuller, Stationarity: Dickey-Fuller (Constant and Trend), Stationarity: Dickey-Fuller (Constant No Trend), Stationarity: Dickey-Fuller (No Constant No Trend), Stepwise Regression (Backward), Stepwise Regression (Correlation), Stepwise Regression (Forward), Stepwise Regression (Forward-Backward), Stochastic Process (Exponential Brownian Motion), Stochastic Process (Geometric Brownian Motion), Stochastic Process (Jump Diffusion), Stochastic Process (Mean Reversion), Stochastic Process (Mean Reverting and Jump Diffusion), Structural Break (Chow Structural Stability Test), Survival and Hazard Tables (Kaplan–Meier), Time-Series Analysis (Auto), Time-Series Analysis (Double Exponential Smoothing), Time-Series Analysis (Double Moving Average Lag), Time-Series Analysis (Double Moving Average), Time-Series Analysis (Holt–Winters Additive), Time-Series Analysis (Holt–Winters Multiplicative), Time-Series Analysis (Seasonal Additive), Time-Series Analysis (Seasonal Multiplicative), Time-Series Analysis (Single Exponential Smoothing), Time-Series Analysis (Single Moving Average), Trend Line (Difference Detrended), Trend Line (Exponential Detrended), Trend Line (Exponential), Trend Line (Linear Detrended), Trend Line (Linear), Trend Line (Logarithmic Detrended), Trend Line (Logarithmic), Trend Line (Moving Average Detrended), Trend Line (Moving Average), Trend Line (Polynomial Detrended), Trend Line (Polynomial), Trend Line (Power Detrended), Trend Line (Power), Trend Line (Rate Detrended), Trend Line (Static Mean Detrended), Trend Line (Static Median Detrended), Value at Risk (VaR and CVaR), Variances Homogeneity Bartlett’s Test, Volatility (EGARCH), Volatility (EGARCH-T), Volatility (GARCH), Volatility (GARCH-M), Volatility (GJR GARCH), Volatility (GJR TGARCH), Volatility (Log Returns), Volatility (TGARCH), Volatility (TGARCH-M), Yield Curve (Bliss), Yield Curve (Nelson–Siegel).
11 Foreign Languages:
Risk Simulator 2012 now supports 11 languages: English, French, German, Italian, Japanese, Korean, Portuguese, Simplified Chinese, Traditional Chinese, Spanish and Russian, complete with the localized languages’ user interface, user manuals, reports, examples, exercises, tools, charts, and more!
Forecast Chart Global View:
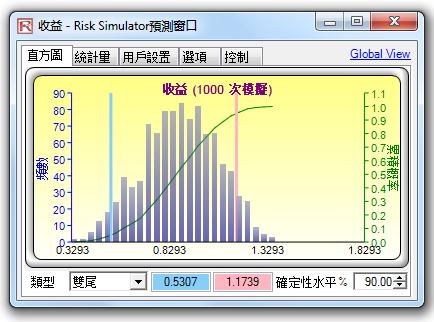
You can now toggle between global view and regular view on the forecast charts where all of the controls from the regular tabbed view are now available in a single comprehensive global view.
Multiple Cell Copy/Paste:
You can now copy and paste multiple cells with noncontiguous assumptions and forecasts.
Distributional Analysis Tool:
The ultra powerful Distributional Analysis tool now has a facelift where you can run PDF, CDF, ICDF and combinations of these on a data grid, copy the computed data, and view different chart types.
Edit Correlation Tool:
The Edit Correlation between input assumptions tool now supports an interactive visual correlation chart.
Excel 2013, 2016 and WIN7/8/10:
This new version supports Windows 7, 8, 10 – 32 and 64 bit versions, and Excel 2013, 2016 – 32 bit and 64 bit versions.
Hands-on Exercises:
This version comes with 140 pages of step-by-step hands-on exercises for running each of the techniques and tools in Risk Simulator and 103 pages of probability distribution details (describing the characteristics and nature of the 45 distributions available in Risk Simulator), complementing the 206-page detailed user manual (translated into 11 languages).
Troubleshooter:
The Troubleshooter tool is now integrated in the Start menu for Risk Simulator, where you can use this tool to obtain the status of Risk Simulator install (e.g., registry settings, COM settings, installation path), restore Risk Simulator if it is disabled, fix Excel security settings, obtain Hardware ID, and more.
Minor Bug Fixes and Enhancements:
This new version includes quicker report generation, scatter plot support in the Overlay Charts tool, simplified drop-list for seasonality selection in the Time Series Forecasting tool, more elegant looking Spider Charts, auto installation of licenses (if you upgrade from the same major version such as from 2012(A) to 2012(B), where the previous license will now be automatically transferred to the new version; this does not apply if you are upgrading from a different major version such as from version 5.X to 2010.X), and many other small enhancements and fixes.
General Enhancements in Risk Simulator Version 5.4 and beyond:
Super Speed Simulation:
This new capability allows you to run simulations at super speeds (50X to 500X faster depending on the model and your processor speed!) by first analyzing your Excel model and then compiling the model into pure mathematical code and running the simulations at very high speeds. Certain models that cannot be compiled will be run at regular speed (e.g., models with VBA functions and macros, links to external data or files, unsupported or wrong functions, and errors in the model).
Turbo Speed Analytics:
We added a new high-speed engine in our forecast methods and analytical tools. Same analyses results as in previous versions but they now run 10X to 30X faster depending on the analysis and your processor speed!
Multiple Excel Versions:
Users with both Excel 2007 and Excel 2003/XP loaded can now easily and seamlessly run Risk Simulator on any Excel versions in a single computer. There is now an Excel version switching tool that allows you to determine which version of Excel to start Risk Simulator with.
Commented Cells:
You can turn cell comments on or off in Risk Simulator’s Options menu, to decide if you wish to show cell comments on all input assumptions, output forecasts and decision variables.
Right-Click Full Menus:
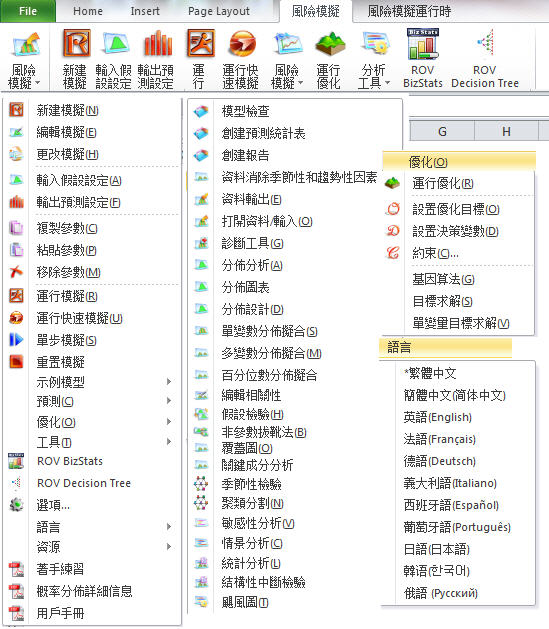
You can now access all of Risk Simulator’s tools and menus using a mouse right click.
Multiple Models Econometrics:
You can now enter in a single equation or multiple equations to run basic econometrics modeling and automatically create tens to hundreds of iterations of the same model through predefined variables as well as shift the data over time.
Super Speed Simulation in Dynamic and Stochastic Optimization:
Simply click on the Advanced button when you run Optimization and select super speed simulation.
Revised Icons in Excel 2010:
Users with Excel 2010/2007 will see a completely reworked icon toolbar that is more intuitive and user friendly. There will be four sets of icons that fit most screen resolutions (1280 x 760 and above).
Enhanced Forecast Charts:
The forecast charts now have additional graphical enhancements.
Truncated Statistics:
If you perform some data filtering in the forecast chart (Data Filter section in the Options tab), the Statistics tab will show the updated statistics based on the truncated data set. If you do not truncate the forecast data, the full dataset’s statistics will be shown as usual.
Chart Controls (3D/Tilt/Move, Colors, Fitting, PDF/CDF):
This is a new tab within the forecast chart whereby you can modify the existing forecast charts including performing distributional fitting on the forecast data set, creating overlay PDF/CDF/ICDF charts, overlaying scatter charts, and changing chart options (chart types, 3D rotation, colors, zoom, tilt, number of decimals, minimum and maximum values to chart on the axes, title name, and many other options, including the ability to save the revised settings and print the chart in various formats).
Auto Econometrics:
This new forecasting tool is used to run hundreds and even thousands of model combinations and permutations using smart heuristics to determine the best-fitting model for your data, by testing linear, nonlinear, lagged, lead, interacting, nested, and other models. This tool is the counterpart to the ROV Risk Modeler software’s detailed autoeconometrics, which is capable of running hundreds of thousands to a few million models on large datasets.
Basic Econometrics:
The existing forecasting tool is now enhanced with new capabilities including the ability to create new variables and functions such as TIME (a linear time-series variable), DIFF (first differencing the time-series data set), RESIDUAL (data from the error term of a forecast equation you specify), RATE (first order ratio of time-series data), and FORECAST (data from the error term of a forecast equation you specify).
Trendline Analysis:
This new tool runs the most common trendlines including linear, nonlinear, exponential, power, moving average, and polynomial models. It returns a series of charts as well as the goodness-of-fit statistics for each model.
Overlay Charts:
This new charting tool is used to compare multiple assumptions and/or forecast variables, by plotting them in a time-series or cross-sectional overlay manner. This allows you to quickly view the similarities and differences in the assumptions and forecasts in easy to read charts.
Segmentation Clustering:
This tool is capable of segregating and clustering or grouping a large set of data into different natural statistical groups by applying some smart algorithms and heuristics.
Create Forecast Statistics Table:
This new tool can create reports of just the key forecast statistics (e.g., mean, median mode, standard deviation, variance, coefficient of variation, skew, kurtosis) as well as confidence levels and probabilities of the output forecast variables you select. The result is a comparison table listing the selected statistics across multiple forecasts.
Flexible Licensing:
There are several new enhancements to our licensing:
Vista users with the user access control turned on or limited users without administrative logins will still be able to enjoy the full functionalities of Risk Simulator by being able to install the software licenses without doing any additional work. To install a new license file you received, simply start Excel, click on Risk Simulator, License, Install License and browse to the license file you are provided to activate the software permanently or for a longer trial period).
Risk Simulator now has the capability of turning on or off certain functionalities to allow you to customize your risk analysis experience. For instance, if you are only interested in the forecasting tools in Risk Simulator, you may be able to obtain a special license that activates only the forecasting tools and leaves the other modules deactivated, thereby saving some costs on the software. The four modules that can be turned on or off are Simulation, Forecasting, Optimization and Analytical Tools. In addition, specific tools in each module can also be turned on or off. This customization is only available for site licenses of more than 10 computers.
Advanced Forecasting Models:
Together with the new forecasting tools and techniques in version 2012, Risk Simulator now has the following forecasting methodologies:
ARIMA (Autoregressive Integrated Moving Average)
- Auto ARIMA
- Auto Econometrics
- Basic Econometrics
- Combinatorial Fuzzy Logic
- Cubic Spline
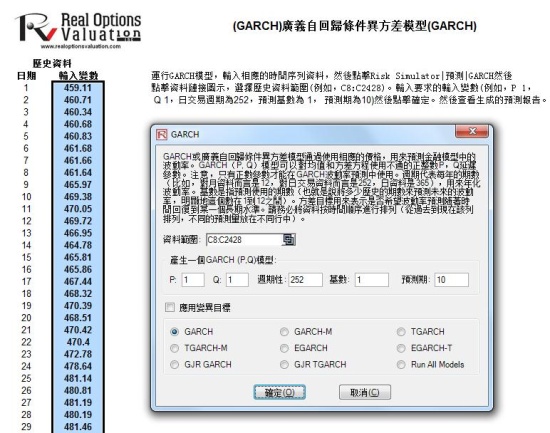
- GARCH (Generalized Autoregressive Conditional Heteroskedasticity)
- J-Curves
- Markov Chains
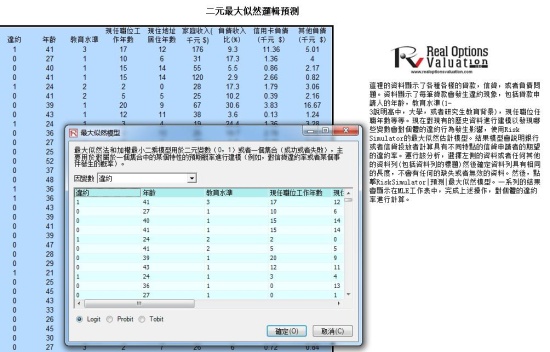
- Maximum Likelihood
- Neural Network
- Nonlinear Extrapolation
- Regression
- S-Curves
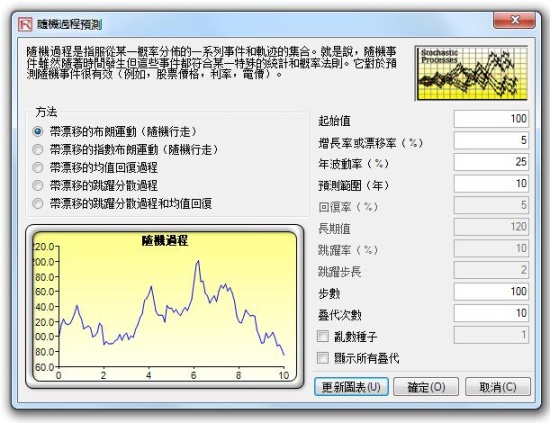
- Stochastic Processes
- Time-Series Analysis
- Trendlines
GENERAL ENHANCEMENTS IN RISK SIMULATOR VERSION 4 AND BEYOND:
Excel RS Functions:
You can now access Risk Simulator functions within Excel by clicking on Insert Function anywhere in your spreadsheet and scrolling to the functions starting with RS. Here, you can set assumptions as well as obtain the forecast statistics of a forecast variable. For instance, you can run the RSAssumptionNormal function to set a normal distribution assumption to a cell, or RSForecastStatistic to obtain the statistics of a forecast cell. In the set assumption forecast, you can set the placeholder or temporary value that is seen before and after a simulation is run (Value), the name of the assumption (Variable Name), and the parameters of the distribution (e.g., Mean, Standard Deviation), as well as other items such as percentile values, correlations, as well as min and max boundaries. For the results, you can also use RSForecastStatistic(A1, “Percentile99.9”) to obtain the 99.90 percentile value of cell A1, where this cell has a forecast parameter set. The functions that can be used include: “PercentileXXX”, “CertaintyXXX”, “Mean”, “Median”, StandardDeviation”, “Variance”, “Skewness”, and “Kurtosis”.
Right-Click in Excel:
You can now use the mouse right-click to access quick Risk Simulator items in Excel, such as set assumptions, set forecasts, and run simulation.
Percentiles and Conditional Means:
In stochastic optimization, additional statistics are now available, including Percentiles as well as Conditional Means, such as obtaining the mean as long as it is > A or < A, which are critical in computing conditional value at risk measures.
Coefficient of Variation (CV):
The mean absolute deviation value is now changed to CV in the forecast chart’s statistics, where CV is the standard deviation divided by the mean, sometimes used as a proxy for volatility, and useful as a relative measure of risk, in comparing different sized projects, as well as being used as a risk-to-return ratio.
Scenario Analysis:
This new tool is used to compute various scenarios in your model, by changing one or two input variables at a time, for a range of inputs, to determine the effects on the output.
Powerful Tornado:
Additional checklists and options are now available, as are a more stable and powerful Tornado analysis (whereby you can now run Tornado across multiple worksheets), global settings (change one setting such as testing 10% upside and downside, and you can control if individual precedents are changed or the entire set of precedents are changed), and highlighting or ignoring possible integer values (sometimes integer values are used as flags in a model and this option helps in identifying potential precedents you may wish to ignore in running the Tornado). Worksheet names are now included in the sensitivity tables for easy identification, and other enhancements are included.
Efficient Frontier:
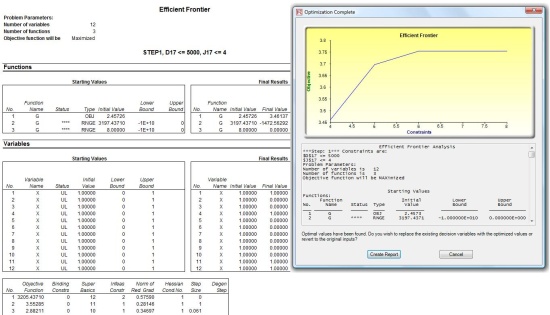
This optimization tool is capable of running multiple sets of optimizations with changing constraints. You can access this tool through the Set Constraints dialog box in optimization. This technique can be run in concurrence with static, dynamic and stochastic optimization.
Re-enable Risk Simulator:
This tool is now available on the Start | Programs | Real Options Valuation | Risk Simulator menu. It allows you to re-enable the software if Windows or Excel temporarily disables the software (this can occur if there is a power outage when you are running a simulation, if you get a virus or Trojan horse on your computer, if you accidentally delete some critical files, and so forth).
Multiphasic Optimization:
The module now is equipped with a Multiphasic Optimization and a test for Local versus Global Optimum in the “Advanced” options button (available when you run an optimization). These two new features, when used together with the existing advanced features, allow the user to have better control over how the optimization is run, and increases the accuracy and dependency of the results.
Statistical Analysis Tool:
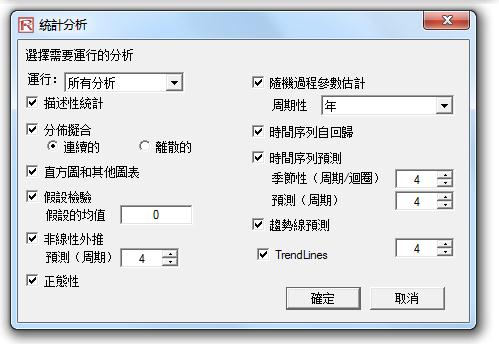
Select the data you wish to analyze, including the headers, and start this tool (located at Risk Simulator | Tools | Statistical Analysis), and the following analyses will be available:
- Descriptive statistics, including all 4 moments of the distribution as well as other confidence measures.
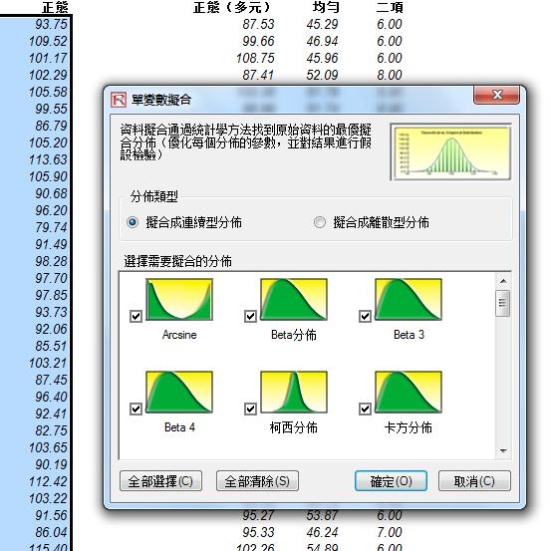
- Distributional fitting, to test if the data set can be fitted to any distributions.
- Hypothesis test to verify if the data are statistically significantly similar or different than a specific value.
- Nonlinear extrapolation to test if the data, a time-series, is nonlinear in nature.
- Normality test to see if the data set is statistically close to a normal distribution. This is an important statistical character because hypotheses tests as well as other modeling techniques require the normality assumption.
- Stochastic parameter estimations, to find the input parameters for a random walk, mean-reverting process, or jump-diffusion process, and to decide if the variations explained are sufficient to justify the use of the stochastic process forecast.
- Autocorrelation tests to see if the history of the time-series data can be used to predict the future.
- Trend analysis to test if the data set follows a linear time-trend and what the level of predictability is.
- Time-series forecasting, to test for the baseline shifts, trends, and seasonality effects of the time-series data.
Advanced Data Diagnostic Tool:
Select the data you wish to analyze, including the headers, and start this tool (located at Risk Simulator | Tools | Diagnostic Tool), and the following: analyses are available:
- Heteroskedasticity.
- Multicollinearity.
- Micronumerosity.
- Nonlinearity.
- Outliers.
- Autocorrelation.
- Partial Autocorrelation.
- Distributive Lag.
- Normality and Sphericity.
- Nonstationarity.
- Stochastic Characteristics.
- Linear and Nonlinear Correlations.
- Variance Inflation Factors.
- Visual Charts.
These tests are vital before starting any types of forecasting or data analysis procedures. Each test comes complete with an easy-to-understand detailed report so that it does not take a trained econometrician or statistician to understand and interpret the results.
Maximum Likelihood:
This is available at (Risk Simulator | Forecasting | Maximum Likelihood) whereby maximum likelihood iterative and internal optimization procedures are used to model binary response variables (the dependent variable is binary, taking on the values of 0 or 1). This is a key discriminant analysis with multiple uses (e.g., determining if patients will develop cancer given some characteristics such as age, cigarettes smoked, blood pressure; or to determine if a credit line or person will default on a loan given the company’s assets, asset volatility, or the person’s age, education level, years at a job, etc).
Multi-Language Support:
We have multiple language support, with English (USA), Chinese (Simplified), Spanish, and Japanese, with forthcoming editions with additional languages. Users can switch between languages midway while working on their models by simply clicking on the Risk Simulator and Languages menu, and restarting Excel.
Microsoft .NET Framework 2.0/3.0:
We have completely upgraded our source code to work seamlessly with Microsoft .NET Framework 2.0/3.0. This translates to higher speed and compatibility with newer computers.
Other Minor Updates:
a. Dynamic Sensitivity Charts are now capable of taking both cell names and cell addresses.
b. Dynamic and Stochastic Optimization routines now support:
Conditional Means and Semi-Standard Deviations for CVar computations
c. Updated examples to showcase the use of Efficient Frontier analysis and multiple models econometrics
d. Updated Japanese user manual
e. Updated language edits and corrections in Spanish reports and Spanish user interface
f. Online resources menu inside Risk Simulator for quick and easy access at your fingertips
系統要求
- Windows 10 or Windows 11 (32 and 64 bits)
- Excel 2016, 2019, 365 (32 and 64 bit)
- Microsoft .NET 2.0 and 3.0, 3.5 or later
- 850MB Hard Drive space
- Administrative Rights to install software
- MAC OS users can run the software as long as they have Bootcamp, Virtual Machine, or Parallels

使用和財會准則委員會 (FASB) 相同的軟體,減少雇員股票期權 (ESO) 上百萬的成本…
了解按照 FAS 123 准則客戶化的二叉柵格是如何計算的,以及它和原始的布萊克-斯科爾斯模型的比較。軟件的創始人是財會准則委員會的咨詢師,財務分析領域的教授,軟件已經被財會委員會應用創建了相關的估價案例。考慮雇員非理想交易行為,喪失率,管制期,保有權,可銷售性折扣,以及隨著時間的變動改變輸入變量(波動率,股息生息率,無風險比率,喪失率等等)可以根據 FAS123 更精確地反映真實,減少成本。
了解 ESO Valuation 軟件是如何正確工作的。
►解決期權問題所使用的方法
- 美式閉合期權
- 二叉和三叉柵格
- 歐式布萊克斯科爾斯模型
- 建立客戶化的期權模型
►可解決的股票期權問題
- 管制期
- 改變喪失率
- 改變無風險比率
- 改變波動率
- 喪失率(交易前和交易後)
- 股價障礙要求
- 非理想交易行為計算
- 交易期
- 所有的奇異變量
Move beyond the academic papers and theoretical realm, and start applying real options with this new software. Real Options SLS is a standalone software and spreadsheet accessible add-in for analyzing and valuing real options, financial options, exotic options and employee stock options and incorporating them into custom spreadsheet models. The newly designed customized option modules allow you to create your own à la carte fully customized models, where all the mathematical equations and functions are visible, thus demystifying the approach and results, making them easier to understand and explain.

ROV Modeler is a comprehensive software suite, developed by Real Options Valuation, Inc., that includes several modules. This software suite takes the modeling outside of Excel and into the database environment, allowing the end user the ability to directly link to databases and large data files, clean the data and run advanced analytics at very high speeds.
![]()
該工具箱涵蓋了風險分析、模擬、預測、Basel II 風險分析、信用違約風險和計量模型等相關領域的 800 多個分析模型、公式和工具以及 300 多個 Excel/ SLS 分析模板和實例試算表。該工具箱是將一系列復雜的數學模型通過 C++ 編譯後嵌入到 Excel 表格中。這 1100 個模型、公式、表格和 SLS 模板主要包括:
►分析
1. 中心極限定理
2. 中心極限定理 (彩票理論)
3. 均值缺陷
4. 數學整合
5. 參數和非參數假設檢驗數據集合
6. 拋體運動
7. 回歸診斷
8. Ships in the Night
9. 統計分析
10. 統計分析
►銀行模型
11.建設貸款審計
12.銀行的建設預算
13.分類盈虧平衡貸款清單
14.分類貸款的借款基准
15.分類貸款的現金預算和透支機制 (facilities)
16.美國聯邦儲備Camels評價系統
17.財務困境公司
18.項目融資風險評級模型
19.排隊模型
20.安然公司現金流分析 (reconciling)
21.風險評級模型
22.Sample Cash Flows
23.敏感性預測分析 (projections)
24.隨機貸款定價模型
25.估值與評價
►信用分析
26.信用違約互換和信用利差期權
27.信用違約互換 (with Counterparty Defaults and Correlations)
28.信用溢價
29.信用風險和對價格影響
30.外部債務評級和利差
31.內部信用風險評級模型
32.新信用的收益成本分析
►債務分析
33.資產權益平價模型
34.利率均值回復下風險債務價格收益率的Cox模型
35.債務償還和攤銷
36.債務敏感性分析
37.隨機資產價格和利率下風險債務的Merton價格
38.Vasicek債務期權估值模型
39.Vasicek風險債務價格收益率模型
►決策分析
40.決策樹基礎
41.EVPI決策樹,極大極小和貝頁斯定理
42.經濟訂貨量和存貨再訂點
43.經濟訂貨量和最優制造量
44.預期效用分析
45.存貨控制
46.排隊模型
►奇異期權
47.美式期權、百慕大期權和歐式期權
48.亞式算術
49.亞式幾何
50.Asset or nothing
51.障礙期權
52.二值期權
53.Cash or nothing
54.商品期權
55.Complex Chooser
56.信用利差期權
57.貨幣期權
58.雙障礙期權
59.外匯資產
60.極端價差
61.外資參股挂鉤外匯
62.外資參股本幣
63.外資參股固定外匯
64.外資收購期權
65.遠期協議
66.期貨和遠期協議期權
67.GAP期權
68.Graduated Barriers
69.指數期權
70.反Gamma虛值期權
71.跳躍擴散
72.峰度偏度期權
73.回望Fixed Strike Partial Time
74.回望 Fixed Strike
75.回望floating Strike Partial Time
76.回望floating Strike
77.Min and Max of Two Assets
78.期權箍
79.期權期權
80.永久期權
81.Simple Chooser
82.期貨價差
83.Supershares
84.Time Switch
85.Trading Day Corrections
86.雙資產障礙期權
87.雙資產現金Two Assets Cash
88.雙資產Two Assets Correlated
89.不定股利Uneven Dividends
90.賣方可延期Writer Extendible
►預測
91.隨機布朗運動
92.數據診斷
93.計量經濟學,相關性分析和多元回歸建模
94.指數J-增長曲線
95.預測的手動計算
96.隨機跳過程
97.線性Linear Interpolation
98.物流G增長曲線
99.馬爾科夫鏈和市場份額
100.均值回復隨機過程
101.多元回歸
102.非線性外推法
103.隨機過程和收益率曲線
104.Stock Distribution at Horizon
105.時間序列分析
106.時間序列ARIMA模型
►行業應用
107.資產負債管理ALM
108.生物技術-制造策略
109.生物技術-許可和交易
110.生物技術-投資估值
111.電力行業-有效前沿Generation
112.電力行業-電力合同風險
113.信息技術-預測
114.信息技術-決策分析
115.養老金-封閉式投資組合匹配
116.養老金-會計建模與優化
117.房地產-商業投資回報率ROI
►優化
118.資本投資 (A部分)
119.資本投資 (B部分)
120.連續投資組合資產配置
121.離散項目選擇
122.存貨優化
123.投資組合資產配置
124.軍用投資組合和有效前沿
125.彈性概念下的最優化定價
126.收益模型優化
127.普通最小二乘優化
128.隨機組合配置
►期權分析
129.二進制數字儀表Binary Digital Instruments
130.逆浮動債券Lattice Maker
131.利差調整債務期權
132.債務期權
133.期權交易策略
►違約概率
134.實証 (個人)
135.外部期權模型 (上市公司)
136.默頓內部模型 (私企)
137.默頓市場期權模型 (行業可比)
138.收益率和價差 (可比市場)
►項目管理
139.成本估計模型
140.關鍵路徑分析 (CPM PERT GANTT)
141.項目時間安排
►實物期權SLS
142.員工股票期權-簡單美式看漲
143.員工股票期權-含等待期的簡單百慕大看漲vesting
144.員工股票期權-簡單歐式看漲
145.員工股票期權-次優交易行為
146.員工股票期權-等待期和次優交易行為
147.員工股票期權-等待期、封鎖期、次優交易行為和員工離職率forfeiture
148.奇異期權-含紅利的美式看漲期權
149.奇異期權-籃子資產計提
150.奇異期權-美式外匯看漲期權
151.奇異期權-美式指數期貨看漲期權
152.奇異期權-障礙期權-下界障礙期權
153.奇異期權-障礙期權-外下界障礙期權
154.奇異期權-障礙期權-上界障礙期權
155.奇異期權-障礙期權-上下雙界障礙期權
156.奇異期權-障礙期權-外上界障礙期權
157.奇異期權-障礙期權-上下界外障礙期權
158.奇異期權-基本美式、歐式和百慕大看漲期權
159.奇異期權-選擇期權
160.奇異期權-股票挂鉤票據
161.奇異期權-含紅利的歐式看漲期權
162.奇異期權-Range Accruals
163.期權分析-香草看漲期權I
164.期權分析-香草看漲期權II
165.期權分析-香草看漲期權III
166.期權分析-香草看漲期權IV、期權分析
167.期權分析-香草看跌期權
168.實物期權-美式放棄期權
169.實物期權-百慕大放棄期權
170.實物期權-自定義放棄期權
171.實物期權-歐式放棄期權
172.實物期權-收縮美式和歐式期權
173.實物期權-收縮百慕大期權
174.實物期權-收縮自定義期權
175.實物期權-雙資產彩虹期權Pentanomial Lattice
176.實物期權-基於Excel的期權模型
177.實物期權-奇異復雜浮動美式選擇期權
178.實物期權-奇異復雜浮動歐式選擇期權
179.實物期權-美式和歐式擴張、收縮、放棄期權
180.實物期權-百慕大擴張、收縮、放棄期權
181.實物期權-自定義擴張、收縮、放棄期權I
182.實物期權-自定義擴張、收縮、放棄期權II
183.實物期權-美式和歐式擴張期權
184.實物期權-百慕大擴張期權
185.實物期權-自定義擴張期權
186.實物期權-四叉網格下的跳躍擴散看漲看跌期權
187.實物期權-三叉網格下的均值回復看漲看跌期權
188.實物期權-多資產競爭期權 (3D網格)
189.實物期權-復雜多階段連續混合期權
190.實物期權-多階段連續混合期權
191.實物期權-同時多階段混合期權
192.實物期權-簡單二叉樹看漲看跌期權
193.實物期權-簡單兩階段連續混合期權
194.實物期權-簡單同時兩階段混合期權
195.實物期權-策略案例-高科技制造策略A
196.實物期權-策略案例-高科技制造策略B
197.實物期權-策略案例-高科技制造策略C
198.實物期權-策略案例-石油和天然氣-策略A
199.實物期權-策略案例-石油和天然氣-策略B
200.實物期權-策略案例-研發階段-門過程A Gate process
201.實物期權-策略案例-研發階段-門過程B
202.實物期權-策略案例-股權置換期權策略A Switching option
203.實物期權-策略案例-股權置換期權策略A
204.三叉網格-美式看漲期權
205.三叉網格-美式看跌期權
206.三叉網格-歐式看漲期權
207.三叉網格-歐式看跌期權
208.三叉網格-美式均值回復看漲期權
209.三叉網格-美式均值回復看跌期權
210.三叉網格-歐式均值回復看漲期權
211.三叉網格-歐式均值回復看跌期權
212.三叉網格-美式均值回復放棄期權
213.三叉網格-美式均值回復收縮期權
214.三叉網格-美式均值回復擴張期權
215.三叉網格-美式均值回復放棄、收縮、擴張期權
216.三叉網格-百慕大均值回復放棄、收縮、擴張期權
217.三叉網格-自定義均值回復放棄、收縮、擴張期權
218.三叉網格-歐式均值回復放棄、收縮、擴張期權
219.四叉網格-美式跳躍擴散看漲期權
220.四叉網格-美式跳躍擴散看跌期權
221.四叉網格-歐式跳躍擴散看漲期權
222.四叉網格-歐式跳躍擴散看跌期權
223.五叉網格-美式彩虹看漲期權
224.五叉網格-美式彩虹看跌期權
225.五叉網格-逆雙執行價格美式看漲期權 (3D網格)
226.五叉網格-逆雙執行價格美式看跌期權 (3D網格)
227.五叉網格-雙執行價格美式看漲期權 (3D網格)
228.五叉網格-雙執行價格美式看跌期權 (3D網格)
229.五叉網格-歐式彩虹看漲期權
230.五叉網格-歐式彩虹看跌期權
231.五叉網格-兩資產交換美式看跌期權 (3D網格)
232.五叉網格-最大雙資產美式看漲期權 (3D網格)
233.五叉網格-最大雙資產美式看跌期權 (3D網格)
234.五叉網格-最小雙資產美式看漲期權 (3D網格)
235.五叉網格-最小雙資產美式看跌期權 (3D網格)
236.五叉網格-組合美式看漲期權 (3D網格)
237.五叉網格-組合美式看跌期權 (3D網格)
238.五叉網格-雙資產價差美式看漲期權 (3D網格)
239.五叉網格-雙資產價差美式看跌期權 (3D網格)
►風險分析
240.一體化風險分析
241.利率風險
242.投資組合風險和收益
►風險對沖
243.Delta和Gamma對沖
244.Delta對沖
245.固定利率和浮動利率影響比較
246.外匯現金流量模型
247.外匯暴露對沖
►敏感性
248.希臘字母
249.颶風圖和線形敏感性圖表
250.颶風圖和非線性敏感度
►仿真
251.基本仿真模型
252.Best Surgical Team
253.相關模擬
254.相關效應模型
255.數據擬合
256.DCF、ROI和波動性
257.債務償還和攤銷
258.需求曲線和彈性估計
259.傳染病
260.招聘預算 (負二項式模擬和多維模擬)
261.VBA宏下的退休基金
262.輪盤賭
263.貨幣的時間價值
►6-sigma
264.假設檢驗的執行區間
265.控制圖 (c, n, p, u, X, XmR, R)
266.Delta精度
267.試驗和組合的設計
268.假設檢驗和自舉法模擬
269.樣本尺寸相關性
270.樣本尺寸DPU
271.樣本尺寸均值
272.樣本尺寸比例
273.樣本尺寸Sigma
274.假設檢驗的統計分析 (CDF,PDF,ICDF)
275.Statistical Capability Measures
276.Unit Capability Measures
►估值
277.APT、Beta值和CAPM
278.購買與租賃
279.頂和底
280.可轉債
281.財務比率分析
282.財務報表分析
283.估值模型
284.估值-權証-混合價值
285.估值-權証-看跌價值
286.估值-權証-權証價值
►在險價值VaR
287.模擬優化組合的VaR
288.Options Delta Portfolio
289.組合業務和資本充足率
290.右尾資本要求
291.靜態協方差法
►波動性
292.EWMA波動模型
293.GARCH波動模型
294.Implied Volatility
295.資產對數收益法
296.現金流對數收益波動性概率
►收益率曲線
297.CIR模型
298.曲線插值BIM
299.曲線插值NS
300.即期利率推遠期利率
301.樣條插值和外推法
302.波動性的期限結構
303.美國國債無風險利率
304.Vasicek 模型

ROV BizStats 是一種專注於用戶友好和強大功能的應用統計工具,作為一款獨立軟件,它可以在電子表格界面中處理已有數據,同時提供關於分析結果和結果深度分析的詳細報告。
ROV BizStats 軟件採用以下模型和方法:
1、絕對值
2、ANOVA:多方法隨機區組
3、ANOVA:單因素多方法
4、ANOVA:雙向分析
5、ARIMA
6、Auto ARIMA
7、自相關和偏自相關
8、 Autoeconometrics (詳細)
9、 Autoeconometrics (快速)
10、平均值
11、組合模糊邏輯預測
12、控制圖:C
13、控制圖:NP
14、控制圖:P
15、控制圖:R
16、控制圖:U
17、控制圖:X
18、控制圖:XMR
19、相關性
20、相關性 (線性)
21、計數
22、協方差
23、三次樣條
24、自定義計量經濟模型
25、數據描述性統計
26、去季節因素
27、差異
28、分布擬合
29、指數J曲線
30、 GARCH模型
31、異方差
32、滯后
33、lead
34、有限因變量 (Llogit)
35、有限因變量 (Probit)
36、有限因變量 (Tobit)
37、線性插補
38、線性回歸
39、LN
40、LOG
41、物流S曲線
42、馬爾可夫鏈
43、最大值
44、中位數
45、最小值
46、眾數
47、神經網絡
48、非線性回歸
49、非線性模型
50、非參數:卡方擬合優度
51、非參數:卡方獨立性
52、非參數:卡方總體方差
53、非參數:Friedman檢驗
54、非參數:Kruskal - Wallis檢驗
55、非參數:Lilliefors測試
56、非參數:運行檢驗 runs test
57、非參數:Wilcoxon符號秩 (One Var)
58、非參數:Wilcoxon符號秩 (Two Var)
59、參數:單變量 (T) 均值
60、參數:單變量 (Z) 均值
61、參數:單變量 (Z) 佔比
62、參數:雙變量 (F) 方差
63、參數:雙變量 (t) 條件均值
64、參數:雙變量 (t) 獨立同方差
65、參數:雙變量 (t) 獨立異方差
66、參數:雙變量 (Z) 獨立均值
67、參數:雙變量 (Z) 獨立佔比
68、Power
69、主成分分析
70、遞增排序
71、遞減排序
72、相對的 LN 收益
73、相對回報
74、季節性
75、分割聚類
76、半標准偏差 (下)
77、半標准偏差 (上)
78、標准二維區
79、標准二維柱
80、標准二維線
81、標准二點
82、標准二維散點圖
83、標准的三維區
84、標准的三維柱
85、標准的三維線
86、標准的三維點
87、標准的三維散點圖
88、標准差 (總體)
89、標准差 (樣本)
90、逐步回歸 (向后)
91、逐步回歸 (相關)
92、逐步回歸 (向前)
93、逐步回歸 (正反向)
94、隨機過程 (指數布朗運動)
95、隨機過程 (幾何布朗運動)
96、隨機過程 (跳轉擴散)
97、隨機過程 (跳轉擴散下的均值回復)
98、隨機過程 (均值回歸)
99、結構突變
100、求和
101、時間序列分析 (自動)
102、時間序列分析 (雙指數平滑)
103、時間序列分析 (雙移動平均)
104、時間序列分析 (Holt-Winter’s Additive)
105、時間序列分析 (Holt-Winter’s Multiplicative)
106、時間序列分析 (Seasonal Additive)
107、時間序列分析 (Seasonal Multiplicative)
108、時間序列分析 (單指數平滑)
109、時間序列分析 (單移動平均)
110、趨勢線 (差分除趨勢)
111、趨勢線 (指數除趨勢)
112、趨勢線 (指數)
113、趨勢線 (直線除趨勢)
114、趨勢線 (直線)
115、趨勢線 (對數除趨勢)
116、趨勢線 (對數)
117、趨勢線 (移動平均除趨勢)
118、趨勢線 (移動平均)
119、趨勢線 (多項式除趨勢)
120、趨勢線 (多項式)
121、趨勢線 (Power Detrended)
122、趨勢線 (Power)
123、趨勢線 (Rate Detrended除趨勢)
124、趨勢線 (靜態平均除趨勢)
125、趨勢線 (靜態中位數除趨勢)
126、方差 (總體)
127、方差 (樣本)
128、波動率:EGARCH
129、波動率:EGARCH - T
130、波動率:GARCH模型
131、波動率:GARCH - M
132、波動率:GJR GARCH模型
133、波動率:GJR TGARCH
134、波動率:對數收益法
135、波動率:TGARCH
136、波動率:TGARCH - M
137、收益率曲線 (Bliss)
138、收益率曲線 (Nelson-Siegel)
項目經濟分析工具(PEAT)
安裝ROV PEAT(項目經濟分析工具)後,啟動軟體並出現閃屏菜單。PEAT有7種語言(英語,簡體中文,繁體中文,韓語,葡萄牙語,俄語和西班牙語),並有幾個主要模塊,簡要介紹如下。
項目經濟分析工具(PEAT)軟體的開發是為了對資本投資,貼現現金流,成本和進度風險項目管理,石油和天然氣應用,醫療分析和企業風險管理進行全面的綜合風險管理分析。該工具將幫助您設置一系列項目或資本投資選項,模擬其現金流,模擬風險,運行高級風險模擬,執行商業智能分析,運行預測和預測建模,根據預算優化您的投資組合,所有其他資源和定性約束,以及生成自動報告和圖表,都在一個易於使用的集成軟件套件中。
- 公司投資(動態貼現現金流)
- 公司投資(租賃與購買)
- 企業風險管理
- 目標分析(銷售人員自動化)
- 醫療保健經濟學(HEAT和REJ)
- 石油和天然氣(油田儲量,採油分析,井型曲線)
- 項目管理(成本和進度風險)
- 公共部門分析(知識增值)
- ROV編譯模型
ROV BIZSTATS
ROV BIZSTATS是一個應用統計工具包,專注於用戶友好性,但仍然足以解決大多數日常統計問題。作為獨立軟件,它還可以處理電子表格中的現有數據,提供詳細的報告,包括分析結果和對結果的深入解釋。
ROV COMPILER
ROV COMPILER 在用於轉換Microsoft Excel XP,2003和2007文件,以將現有模型提取為純數學關係和代碼,以便模型可以照常使用,但模型的知識產權受到保護。您現在可以使用Excel作為軟體開發工具,而不僅僅是建模工具。也就是說,假設您是某個行業的專家,如銀行,製藥,生物技術,製造,保險,航空等,並進一步假設您已開發出適合其他人使用的Excel模型和工作表。相同的領域。您現在可以使用ROV編譯器從現有的Excel模型創建可執行的EXE文件; 將數學,業務和計算邏輯鎖定為二進制代碼; 並為您的文件創建極其安全的硬體鎖定許可保護,可以像軟件程式一樣分發。運行時,編譯後的文件將具有Excel的精確外觀,減去訪問關鍵計算邏輯的能力,以及像常規軟體程式一樣獲得安全和許可的能力。
ROV EXTRACTOR AND EVALUATOR
ROV EXTRACTOR和ROV EVALUATOR軟體由Real Options Valuation,Inc。提供給您,用於Excel 2007及更高版本。此軟體旨在用於Microsoft Excel 2007內部,以將現有模型提取為純數學關係和代碼,以便模型可以在Excel外部運行。
ROV MODELER / ROV OPTIMIZER /ROV VALUATOR
ROV RISK MODELER 是由Real Options Valuation,Inc。開發的綜合軟件套件,包括幾個模塊。該軟件套件採用Excel外部的建模和數據庫環境,允許最終用戶直接鏈接到數據庫和大型數據文件,清理數據並以極高的速度運行高級分析。
ROV DASHBOARD
ROV DASHBOARD 是一種企業軟體應用程式,可以安裝在具有多個用戶的企業服務器上,也可以作為桌上型電腦上的獨立軟體應用程式使用。
ROV WEB MODELS
ROV WEB MODELS是一組可在Internet上使用Internet Explorer或Firefox瀏覽器訪問的模型和功能。
- Web上提供800多種高級功能和模型
- 我們的數學模型可以OEM到您自己的專有系統中
- 可定制的Web頁面,滿足您的業務需求(我們可以使用您選擇的模型創建計算頁面)
- 具有快速結果的快速計算器與情景表和圖表的詳細輸出
- 所有數學,財務和分析模型都經過了現場教授和專家的檢查和雙重檢查
- 與ROV Risk Simulator和ROV Modeling Toolkit軟體應用程式完全兼容
- 比單個登錄帳戶上具有多個用戶的單個桌面許可證便宜
- 無需安裝大型軟體應用程式即可在世界任何地方訪問
ROV QUANTITATIVE
歡迎使用Real Options Valuation,Inc。為您提供的ROV QUANTITATIVE DATA MINER(QDM)軟件。該軟件應用程序用於分析數據處理和建模。它在Windows環境中運行,可用於鏈接到數據庫,以極高的速度下載和運行大型數據集。該軟件有三個獨立的模塊。第一個模塊是主要的ROV定量數據採集器(QDM),其中包含大約150種運行數據建模,分析,預測,模擬,數據計算和圖表的方法。第二個模塊是ROV優化器,用於在大量決策變量上高速運行靜態,動態和隨機優化。第三個模塊是ROV Valuator,具有600多種封閉形式,偏微分,格子和分析模型。
ROV LARGE SCALE RISK OPTIMIZER (LSRO)
ROV大規模風險優化器(LSRO)既是用C ++編寫的獨立工具,用於執行大規模優化,也是一組DLL或動態鏈接庫,可以從其他專有軟體工具(C ++和C#)調用。 NET軟體)。這種大規模優化器可用於在線性和非線性模型中運行數十萬個決策變量,並作為獨立工具存在。
ROV SOFTWARE DEVELOPMENT KIT (SDK-OEM)
本公司Risk Simulator 軟件和ROV Modeler 軟體中的 C# .NET AND C++分析代碼庫SDK 可提供用於您專有軟件工具的OEM和SDK部署。該SDK包附帶若干動態鏈接庫(DLL)文件和用戶手冊,手冊中詳細說明了如何一步步將它與其他軟體包整合。由於Visual Basic、C++.NET和J#等.NET語言的編程是相似的,熟悉這些語言就可以快速掌握SDK包的使用。

