SuperSMITH 軟體是專為可靠性和統計分析而設計的,用於預測壽命、安全性、存活能力、風險、成本和保修索賠,以及通過使用Weibull、log normal、Crow-AMSAA、probit和Kaplan-Meier模型進行加速測試的證明。
SuperSMITH 軟體是唯一與由Robert Abernethy博士撰寫的行業領先的Weibull手冊兼容的軟體。
SuperSMITH包含三個獨立的程式,但它們都包含在軟體包中並且可以相互配合使用
SuperSMITH Weibull
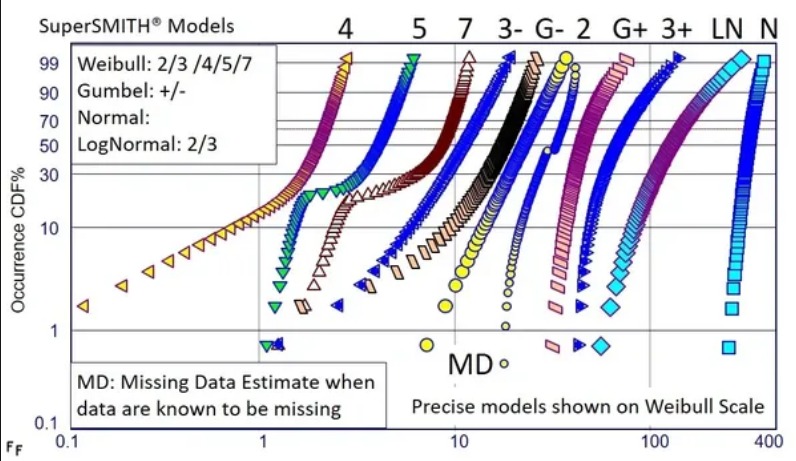
“SSW” - makes probability scale plots showing for each data set the associated model fit line going through or near the input data measurement points. SSW solves for graphical (regression) and non-graphical (likelihood) fits to the input data. Distribution models include Weibull, normal, lognormal, Gumbel lower, and Gumbel upper. Analysis includes support for different input data types with their associated solution methods, distribution analysis for finding the best-fitting model, confidence estimation for lower and upper bounds, 3-parameter solution, and 1-parameter solution. Tools include optimum replacement interval for lowest cost, Abernethy risk for forecasting, basic mixture solution, Barringer process reliability, test planning, and accelerated testing covariate solution.
SuperSMITH Visual
“SSV” – generates standard X-Y plots, log-scale plots, Arrhenius scale plots, pie graphs, and bar charts. Analysis includes curve fitting, function viewing, and global data transforms. Tools include Crow-AMSAA (C-A) reliability growth trending, Nelson recurrent event solution, and forecasting with the C-A model. SSV also provides the auxiliary plotting engine for SSW table output visualization for forecasts and costs, confidence contour visualization, and associated SSW plots like density function, hazard function, and aggregate cumulative hazard (ACH).
SuperSMITH YBath(TM)
“SSY” – provides advanced mixture solutions for multiple underlying distributions in the same set of data. Mixture solutions include 4-parameter “Competing Risk”, 5-parameter “Competing Risk Batch”, 5-parameter “Exclusive Or”, and 7-Parameter Competing Risk mixture, which models the Bathtub curve of infant mortality, chance, and wear out. Methods include graphical (regression) and non-graphical (likelihood).
In addition to the three analysis programs, there is a common HELP program that can be called from any one of the individual programs. This file also has a "Best Practice" flow chart guide, descriptions of the icons, and a detailed summary of the models and methods available.
Software Inclusions
Weibull Analysis Includes
- Plotting the data and interpreting the plot
- Failure forecasting and prediction
- Evaluating corrective action plans
- Test substantiation for new designs with minimum cost
- Maintenance planning and cost effective replacement strategies
- Spare parts forecasting
- Warranty analysis and support cost predictions
- Controlling production processes
- Calibration of complex design systems
- Recommendations to management in response to service problems
Data Problems and Deficiencys include
- Censored or suspended data
- Mixtures of failure models
- Nonzero time origin
- Unknown ages for successful units
- Extremely small samples (as small as one failure)
- No failure data
- Early data missing
- Inspection data, both interval and probit
Failure Types Include
- Development, production and service
- Mechanical, electronic, materials, and human failures
- Nature; lightning strikes, foreign object damage, human error, woodpecker holes in power poles
- Quality control, design deficiencies, defective material
- Warranty claims
Math Modeling for System Analysis Include
- Explicit models for independent failure modes
- Monte Carlo simulation for dependent failure modes
- Reliability growth, repairability, and management tracking using Crow-AMSAA models
- Exponential, Binomial and Poisson models
- Warranty claims models
- Production process control models


