FusionCharts Suite 可幫助您建立令人驚嘆的圖表、儀表板與地圖,在您的企業網站及企業應用程式上。使用它可以建立傑出的報告、分析、監測、調查和操作見解。
FusionCharts Suite是業界領先的企業級圖表元件功能無縫結合PC、Mac、iPad、iPhone和大部分的移動裝置。FusionCharts Suite利用Flash 和 JavaScript (HTML5)來建立令人驚奇的圖表,同時可以搭配 XML和JSON資料。FusionCharts可以整合任何伺服器端的技術(ASP, ASP.NET, PHP, JSP, ColdFusion, Ruby on Rails 等等)與資料庫。

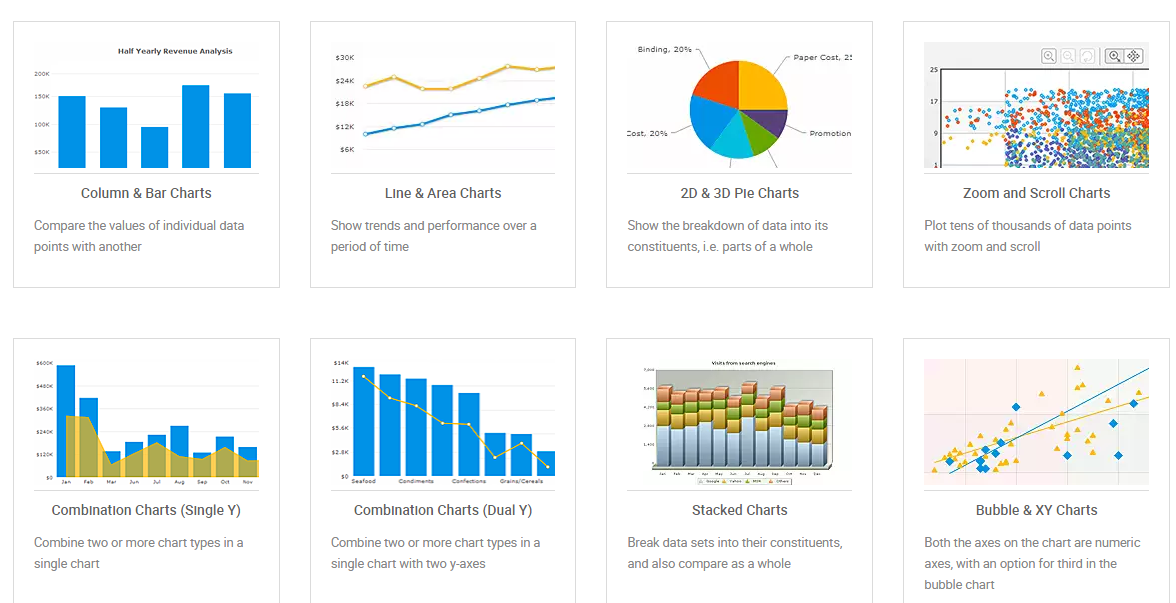
FusionCharts Suite提供超過90種不同的圖表類型,使創造數據圖表在FusionCharts Suite上是一件輕而易舉的事情。FusionCharts Suite使用顧客有24,000家以上企業和在120國家超過50萬的開發者,包括了前500強企業和網絡上最流行的網站。FusionCharts Suite是幫您建立動態與互動式的圖表提供網站與企業應用的最佳選擇。
FusionCharts Suite 包含以下四個套件:
FusionCharts Suite consists of 4 products that provides you with the most comprehensive data visualization solution in the industry — FusionCharts XT, FusionWidgets XT,FusionMaps XT and PowerCharts XT.
FusionCharts XT
With 50+ chart types, FusionCharts XT consists of the most commonly used charts like column, line, and pie for your reports and dashboards.
FusionWidgets XT
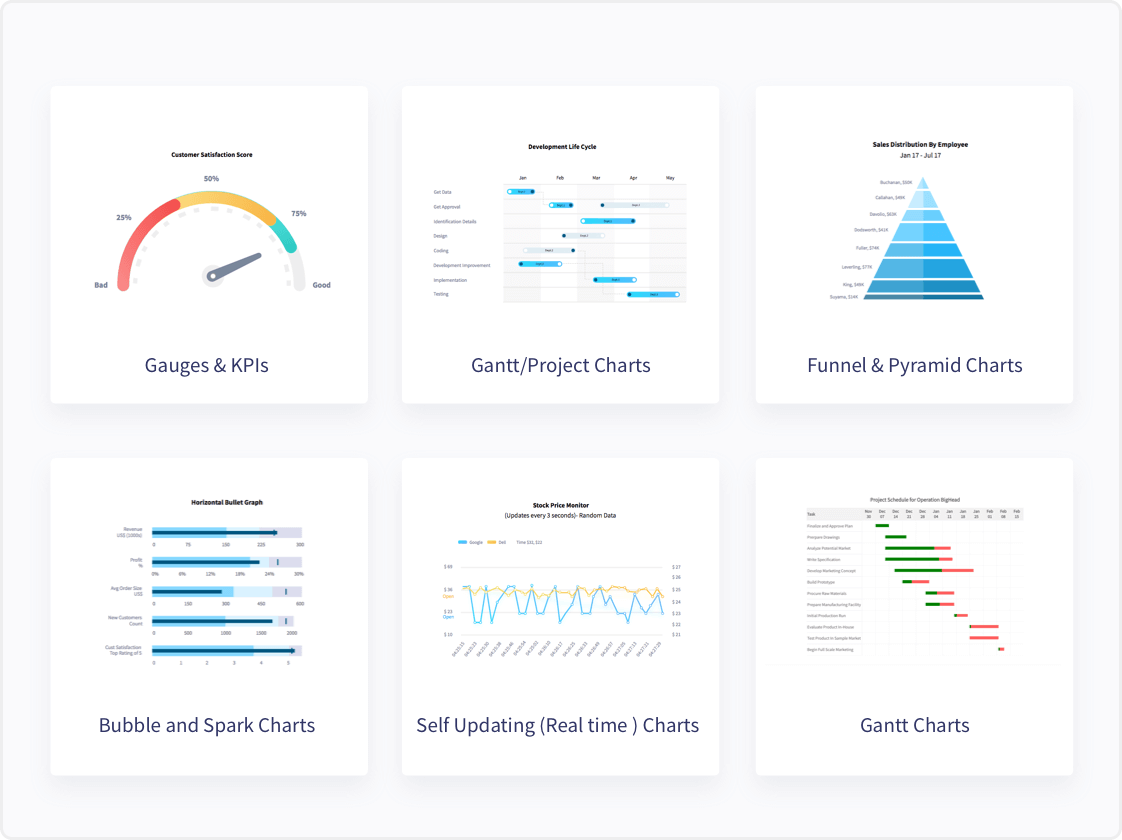
From Gauges and KPIs to funnel and pyramid charts, FusionWidgets XT makes your dashboards and monitors a lot more insightful.

PowerCharts XT
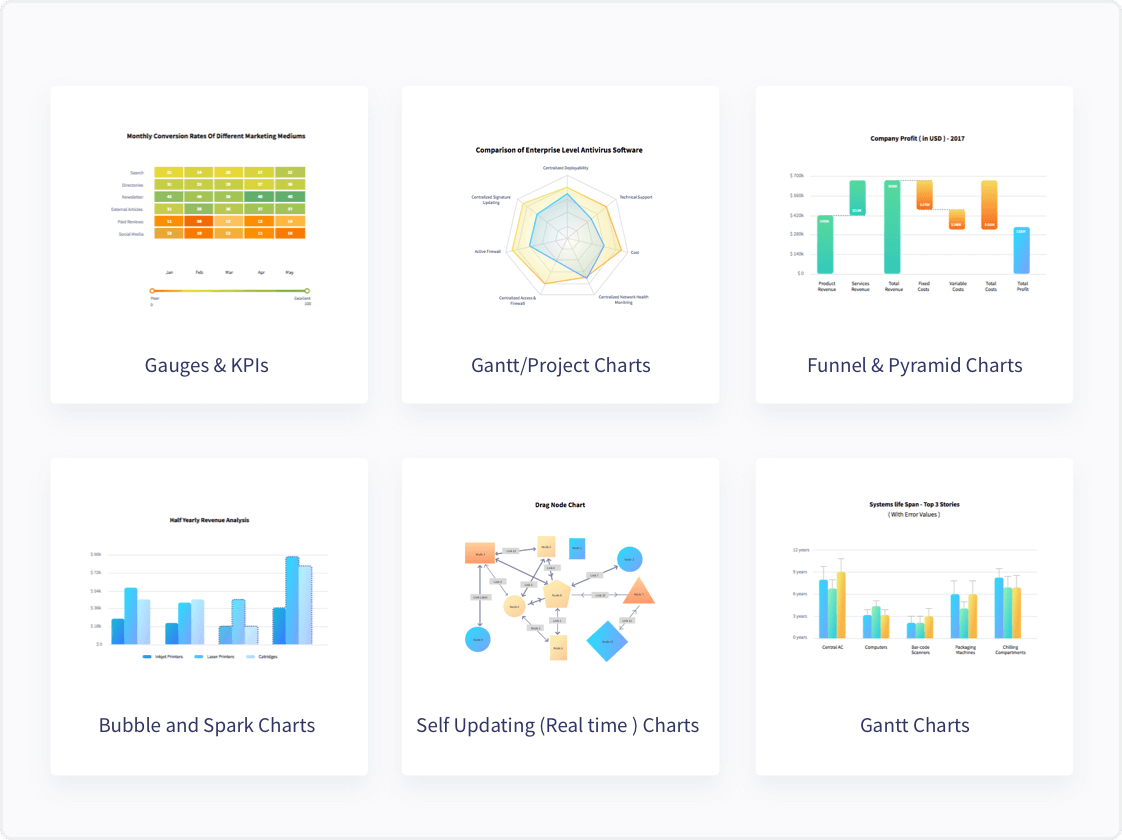
With the inclusion of heat & treemaps, radar, and statistical charts, PowerCharts XT is a set of advanced charting widgets for domain-specific usage.

FusionMaps XT
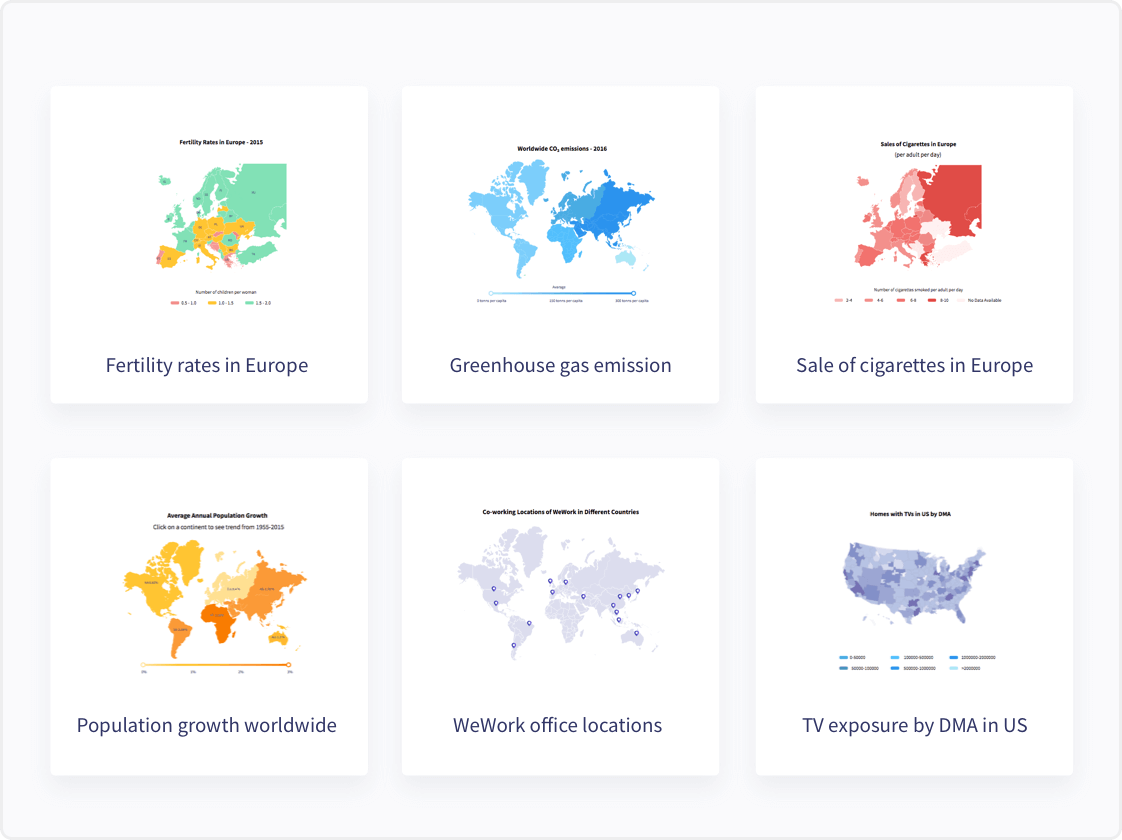
Plot your crucial business data like revenue by regions with over 2000 data-driven maps that are included in FusionMaps XT.

迷人外觀
FusionChartsSuite 帶給您前所未見的漂亮圖表。令人興奮的動畫,可以給人很好的第一印象,此外現代與美麗的設計保持這種印象。
方便使用
FusionCharts 不僅是只有好看與美化工程。你只需要15分鐘,即可以創建您的第一個圖表,在PCs、Macs、iPads、iPhones和大部分行動設備。
強大的報告
給用戶體驗無限深入的完整報告、自動輸出,完整的AJAX整合和詳細的工具提示。
全方位圖表
擁有90個圖表類型,讓您的數據將有正確的圖表可以顯示。 FusionCharts Suite提供所有通用的圖表,如:進階的放大線圖表、即時圖表及視覺化編輯圖表。
簡單數據分析
幫助用戶了解他們的數據,透過提供使用趨勢線與數量規模,以及便於分類的顏色區別,增加數據可讀性。
值得信賴的解決方案
FusionCharts Suite 是業界領先的企業級的圖表組件,前500強企業和網絡上最流行的應用程式大部分都使用FusionCharts Suite。
| Find a plan that's right for you. |
Basic | Pro | Enterprise | Enterprise+ |
| Perfect for a small internal app or dashboard | Perfect for SaaS apps with small teams | Perfect for SaaS apps with large teams & require on-prem | Perfect for unifying your charts across your organization | |
| Developers | Up to 1 | Up to 5 | Up to 10 | 11+ |
| Number of products | Single | Single | Single | UNLIMITED |
| Internal Apps | V | V | V | V |
| SaaS Apps | V | V | V | |
| On Prem Apps (OEM) | V | V | ||
| Software Updates | Always Latest Version | Always Latest Version | Always Latest Version | Always Latest Version |
| Technical Support | Community | Professional | Professional | Professional |
| Full Source Code | V | V | V | |
| FusionGrid | 詳情請洽友環業務 | 詳情請洽友環業務 | 詳情請洽友環業務 | Included |
| FusionCharts | V | V | V | V |
| FusionWidgets | V | V | V | V |
| PowerCharts | V | V | V | V |
| FusionMaps | V | V | V | V |
| FusionTime | V | V | V | V |
| FusionExport | V | V | V | |
| Froala Editor Add-On | V | V | V | V |
FusionTime
Create high-performance time-series visualizations and stock charts
FusionTime helps you visualize time-series and stock data in JavaScript, with just a few lines of code. Whether it’s a simple time-series chart, stock chart, millions of data points in a chart, or even complex multivariate analysis, it can render all of them with the same ease-of-use.
You get out-of-the-box interactivity like time navigator, date range selectors, tooltips with crosslines, interactive legend and much more. In addition, you can plot your data as column, line, area,candlestick, OHLC and even variants like stacked column & area, and overlay them with event and data markers. And the best part is - the same chart runs across desktop, tablet and mobile.
FusionTime is compatible with all modern browsers.

FusionTime works with your favourite framework.
- Angular
- Angular JS
- React
- React Native
- Vue
- JQuery
- Ember
- PHP
- Java
- ASP.NET
- Django
- Ruby on Rails
FusionExport
Export full Dashboards as PDFs for use in reports and emails
Export full dashboards in multiple formats. Go beyond export of individual charts - enable download of live dashboards or automatically generate them on server in an email-friendly format. FusionExport enables you to convert your live dashboards to PDF or images. It works with all JavaScript charting libraries (FusionCharts, HighCharts, d3, Chart.js or others) and is easy to install. It includes SDKs for Java, Node.js, C#, Go and many more. Not only can you export a dashboard as-is, but you can also add new elements to the exported
dashboard on-the-fly including your brand logo, colors, additional data in the form of tables, and anything else that you want.
Works with your favourite SDK API
- ASP
- .NET
- JS
- Java
- PHP
- Python


