GPS-X
GSP-X能使污水設施的設計更有效率並周全地評估到每一個環節。GPS-X被譽為是世界上最大的污水處理廠模擬和優化應用工具,開發商為Hydromantis。
GPS-X是廢水處理系統動態模擬的強大工具,它內含大量模型,實際汙水處理廠中所能遇到的單元過程幾乎都被包括在內,甚至包括高級的脫氮模型、固定化生物膜工藝、厭氧反應器、二沉池模型、初沉池模型以及污泥處理的幾個單元過程。通過對圖表的操作就可以完成自己的汙水處理廠的配置和輸出,並且可以為各個單元選擇適當的過程模型和參數值。
GPS-X 是最先進的廢水過程模擬系統。可提供給工程師一個最容易使用又有效的介面和最全面的廢水模型流程分析工具。
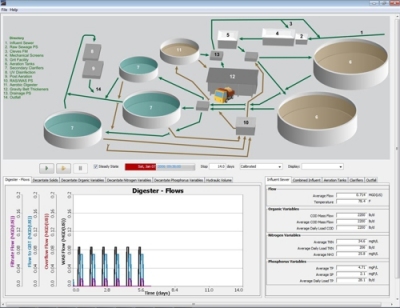
更新介紹
- Cloud licensing scheme
- New Unit Processes
- High-Rate Primary Filter
- High-Rate Biological Filter
- Centrifuge
- Belt Press Thickener
- Gravity Belt Thickener
- New Aeration Model Features
- Surface oxygen intrusion (correlated to mixing) for anoxic/anaerobic tanks
- Dynamic Alpha Factor (correlated to soluble substrate COD)
- Improved Steady-State Solver for Oxidation Ditches
- MantisIW (Industrial Wastewater) Library now included in all licenses
- Petrochemical components (VOCs, sulfur, etc.)
- API oil/water separator unit
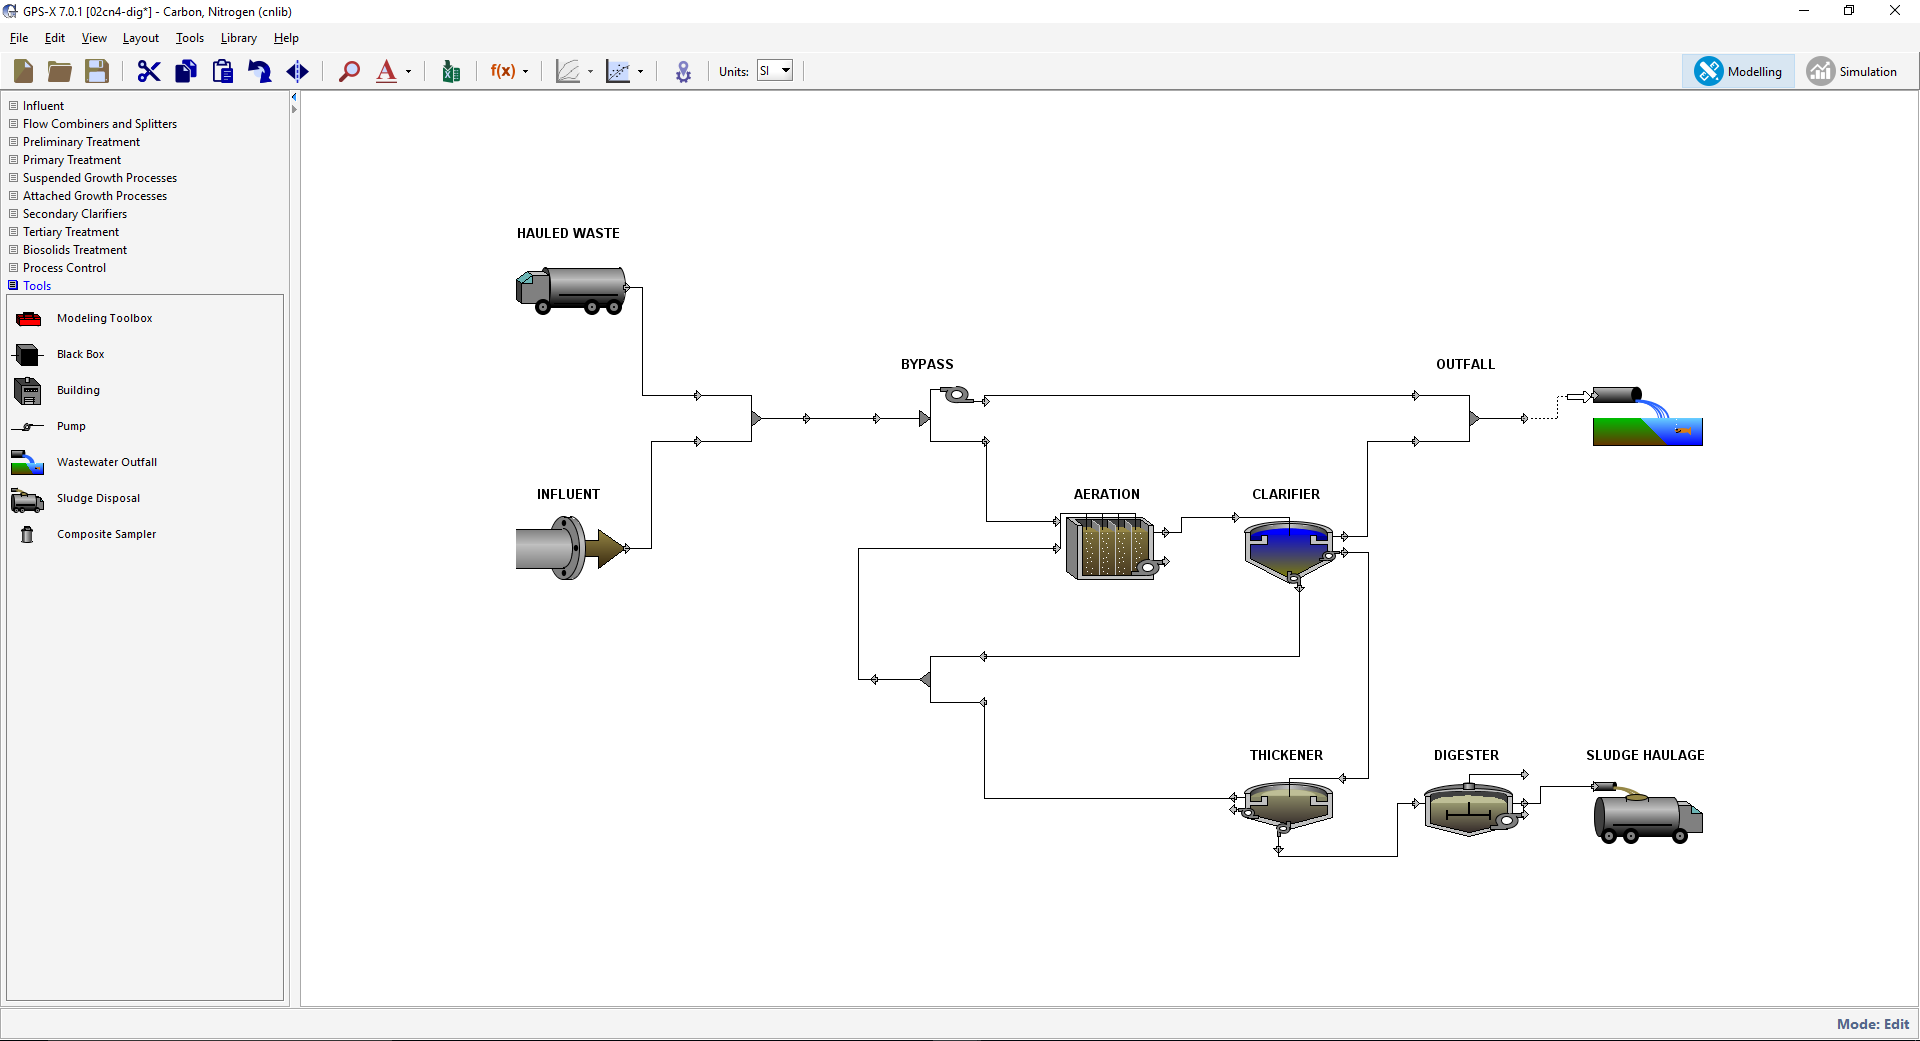
Drag-n-Drop Modelling
Quick and intuitive means of creating your model layout.
Drag and Drop
Simply drag the unit processes onto the drawing board to lay out your plant.
Connection Paths
Drag the connections between the unit processes to define the flows.
Customize
Change labels of processes and streams for simple identification.
Move the processes and connection paths to make the layout simple to follow.
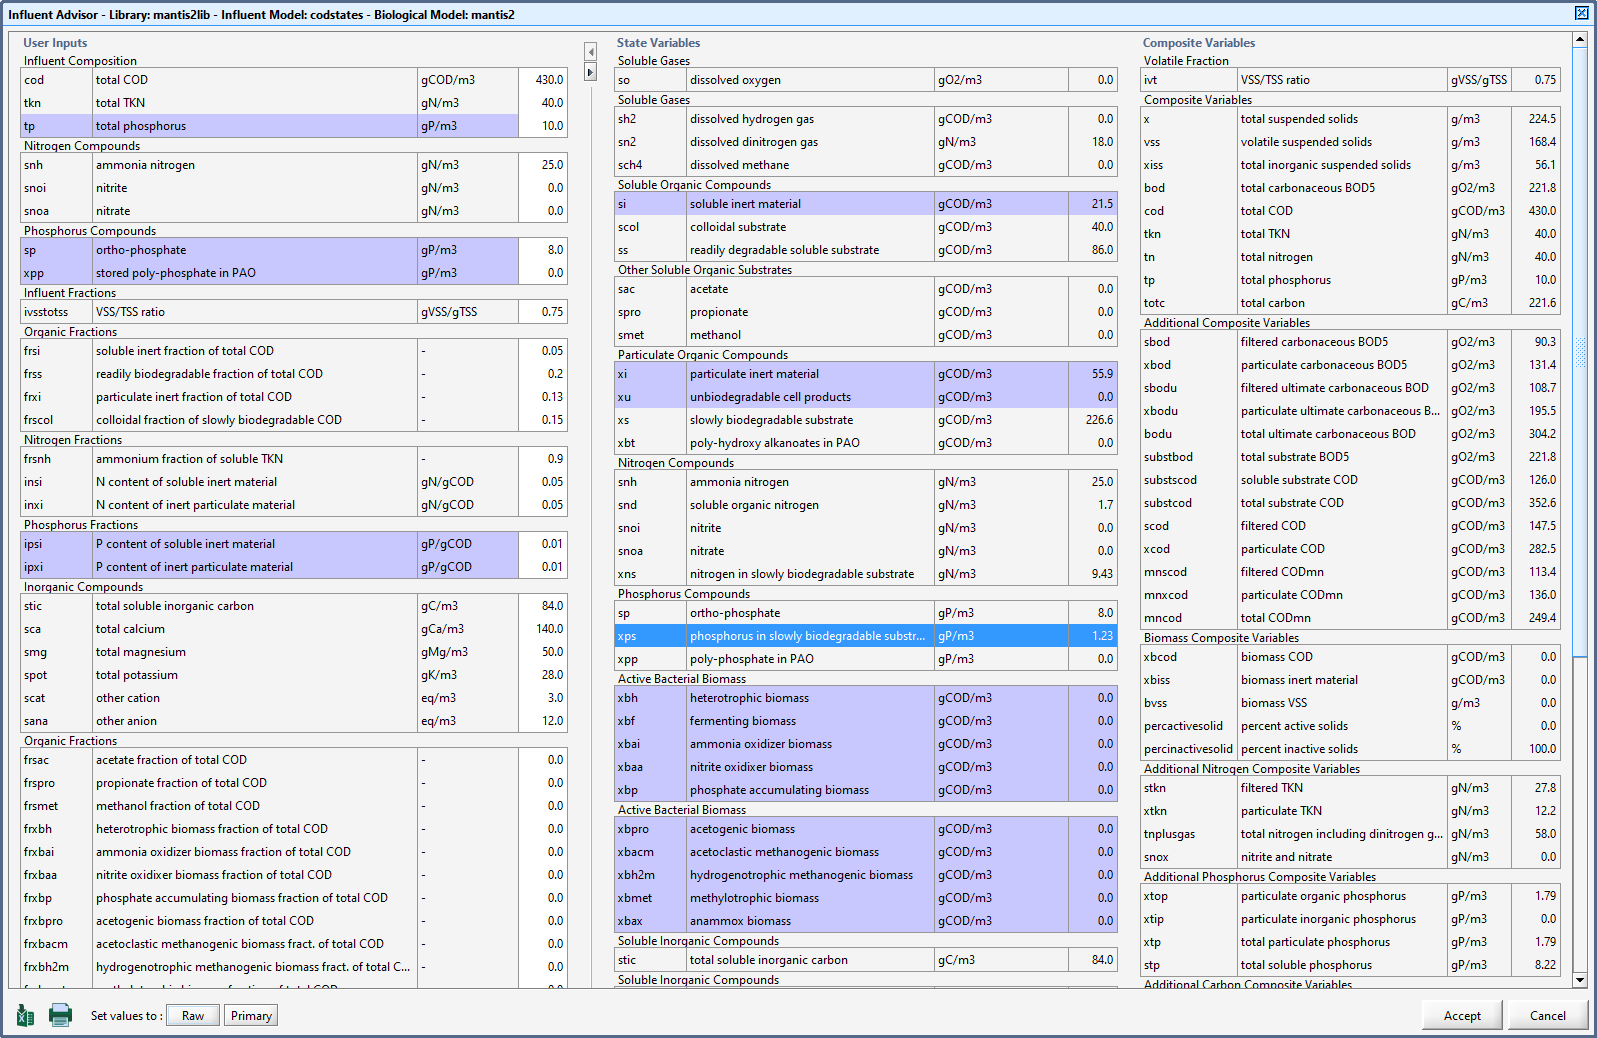
Influent Advisor
Validate the accuracy and consistency of your influent data.
The Problem
The mathematical description of the influent wastewater that is fed to the plant model is the single most important aspect of a simulated system. Without significant consideration of the influent characterization, the plant model will be limited in its ability to predict the dynamic behavior of the plant and match actual process data.
The Solution
The GPS-XTM Influent Advisor makes it simple to navigate the influent models and achieve the influent characterization most consistent with the available measured data.
How it Works
Simply click on the variable of interest and all of the variables that are involved in the calculation will be highlighted.
This built-in tool eliminates the step of cutting and pasting data from a spreadsheet to a model layout.
Interactive Controllers
Manage how model inputs are adjusted throughout a simulation run.
Direct Controllers
Slider Control: Adjust the independent variable's value by moving the indicator back and forth on the track or edit the value directly in the text field.
Increment Control: Use the two buttons to add or subtract a specified amount to the independent variable or edit the value directly in the text field.
Discrete Control: An example is an on/off button allowing the activation/deactivation of the independent variable.
Indirect Controllers
File Input Control: This type of controller will read in data from a file. It can handle both discrete and continuous data.
Analyze Control: This one automatically varies the value of the independent variable with your specified values for the minimum, maximum, and incremental values.
Optimize Control: This controller is used by the solver to automatically adjust the variable to determine the optimal value for the targeted result.
Scenarios
Create multiple cases that are modifications to the base model layout.
Uses of Scenarios
Organize
Instead of keeping track of multiple layout files, you can create a single base layout and use it to create multiple instances of data set modifications.
Compare
Compare the differences between scenarios.
View
View the variables that are changed in the scenario.
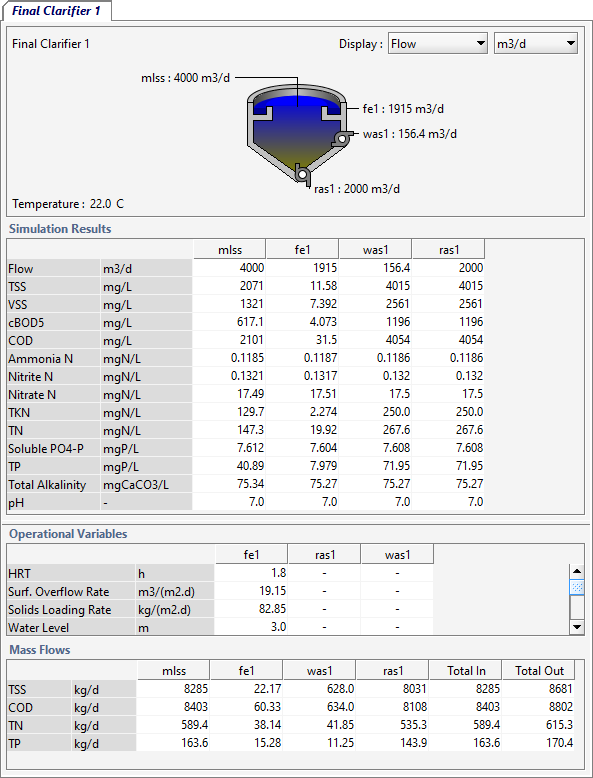
Quick Displays
These displays are automatically generated for each unit process within the model layout and display the most important stream properties and process variables.
The values are all updated in real-time and can easily be exported to Excel for further analysis and retention of simulation results.
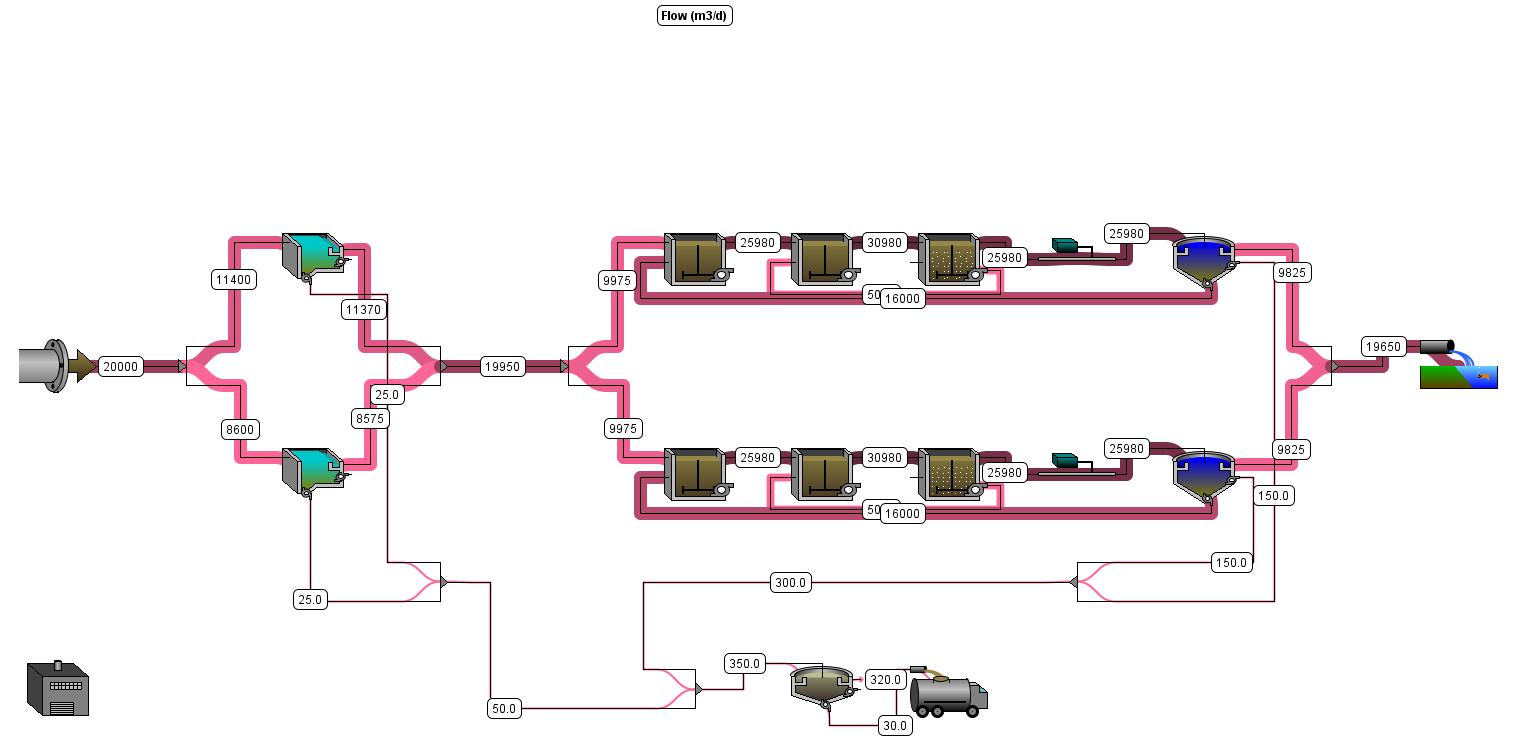
Sankey Diagrams
Provides a visual representation of the flux of a given quantity throughout the model layout.
he GPS-XTM Advantage
There is no more need to manually draw these diagrams by yourself or attempt to learn and use some other graphic software.
GPS-XTM can automatically generate a Sankey diagram for many different components like flow, solids, and nutrients that are tracked throughout the plant and the values of these variables are superimposed on the layout that you created in GPS-X.
If you need to update your model in the future, simply rerun your simulation, click the button to view the new Sankey diagram and export the image for use in your report or PowerPoint slide.
Energy Usage and Operating Cost Summaries
Provides a plant schematic output summary of the amount of energy used or the operating cost of the plant.
Energy Usage Variables
|
Operating Cost Variables
|
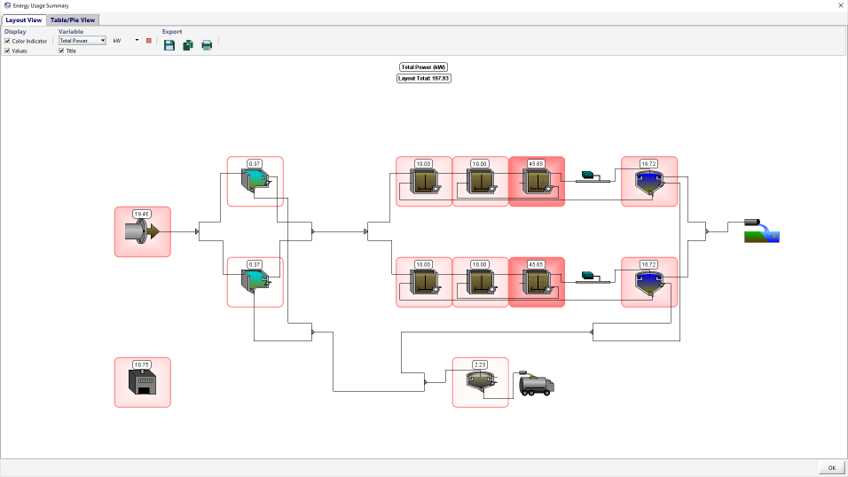
Layout View
This view presents an image of the layout with 'hot spots' around the unit process representing the value of the variable selected. A larger value is indicated by a more intense color.
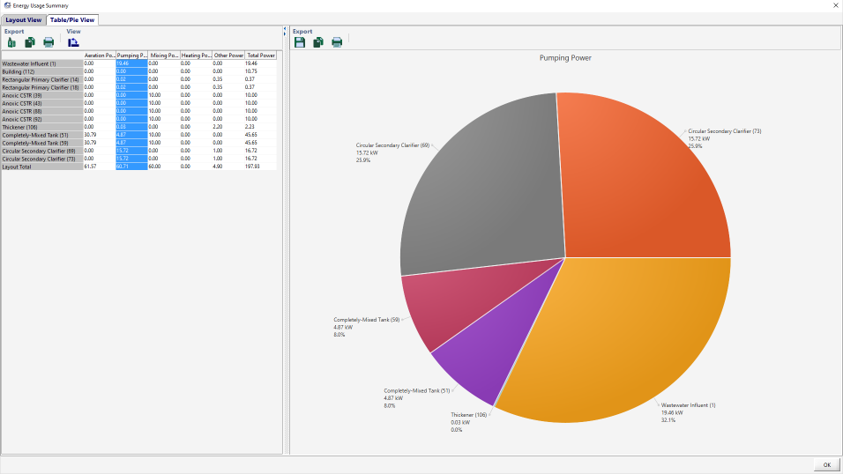
Table/Pie View
The window is separated into two sections:
Table - Provides a summary of the energy usage or operating cost values throughout the layout
Pie Chart - Representation of either the selected row or column of data
Statistical Analysis
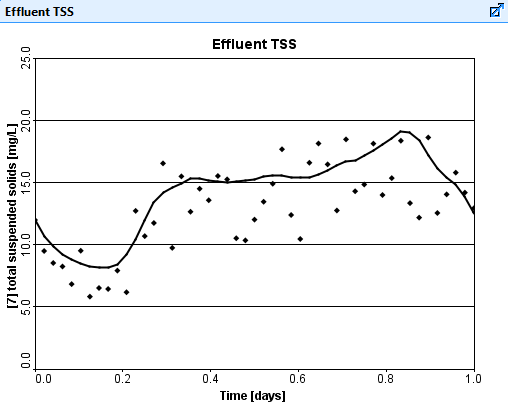
Qualitative and quantitative statistical analysis can be performed within GPS-XTM.
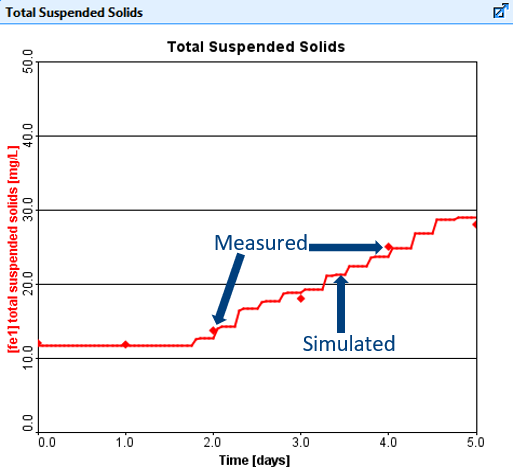
The built-in statistical analysis tool in GPS-XTM allows the user to statistically compare the measured and simulated datasets during model calibration and validation studies. The statistical analysis tool allows for qualitative assessment through visual representation as well as quantitative assessment through a set of statistical indices.
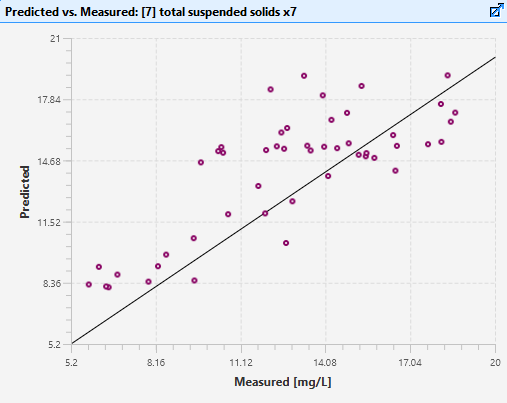
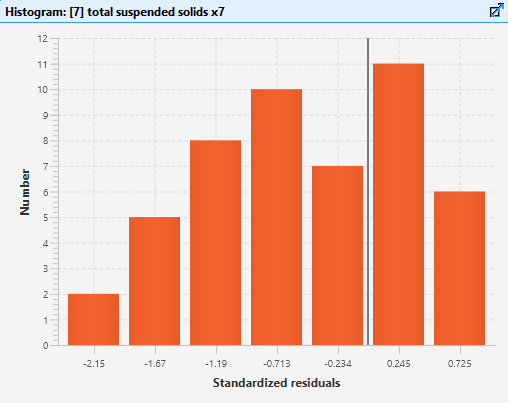
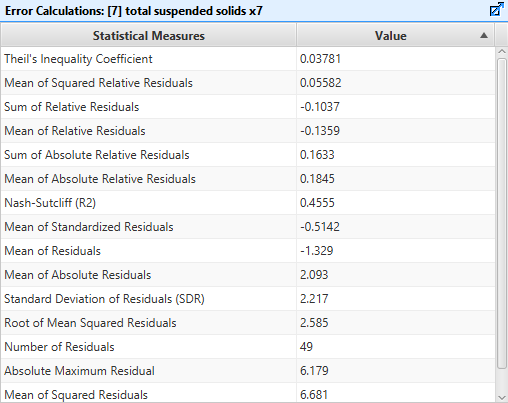
Data Comparison
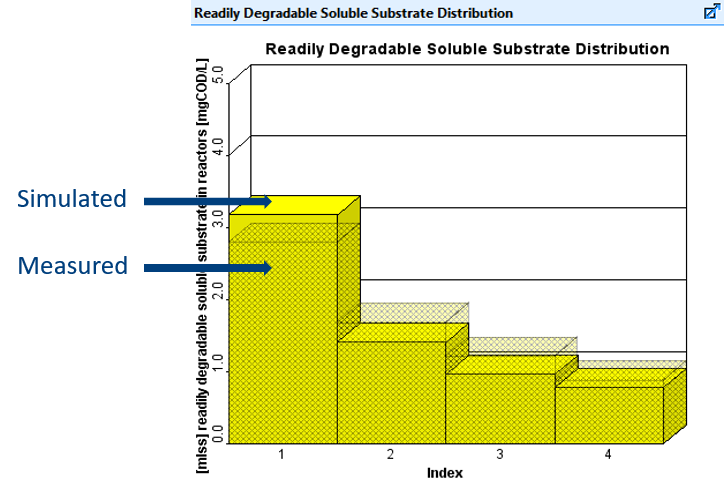
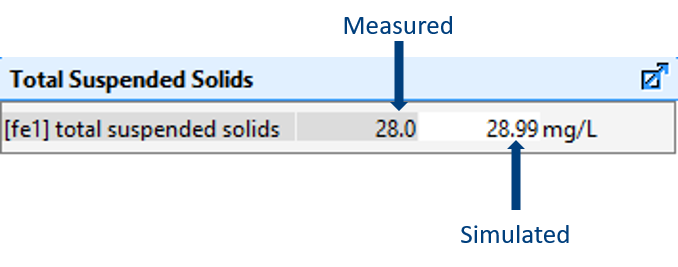
The measured and predicted values for steady state simulation now can be compared on digital outputs, tabular outputs and bar charts for easy visualization and efficient calibration.
Advanced Data Handling/Reporting Tools
Import and export data from GPS-XTM with the click of a button.
Excel spreadsheet reports can be generated directly from GPS-XTM, showing all simulation data and images in a well organized tabular format. A standard list of check boxes allows you to include/exclude various types of information to make the report more manageable.
| Feature | Standard | Pro | Pro+ |
| Mantis2 - Comprehensive Bio-chemical Whole Plant Model | V | V | V |
| Mantis2S - Sulfur and Selenium Model | V | V | V |
| Mantis3 - Greenhouse Gas and Carbon Footprint Model | V | V | V |
| Controllers | V | V | V |
| Model Builder | V | V | V |
| Model Developer | V | V | |
| Analyzer | V | V | |
| Optimizer (Standard) | V | V | |
| Python Scripting Integration | V | ||
| Dynamic Parameter Estimation | V | ||
| Advanced DDO Optimizer | V | ||
| On-line Data Reading | V | ||
| MATLAB Link | V | ||
| SCADA to GPS-X Data Conversion Tool | V | ||
| Database Connectivity | V |
SimuWorks
Dashboards for Operator Training and Plant Analysis 
SimuWorks is an industry first - a flight-simulator for water and wastewater treatment plants. Leveraging the proven technology of Hydromantis' GPS-XTM, the industry's most advanced mathematical modelling and simulation software, SimuWorks takes training and plant analysis opportunities to new heights.
SimuWorks represents an evolution in the use of water and wastewater treatment simulation and modelling technology, extending its use beyond the engineering offices. Utilizing customized operator interfaces, SimuWorksTM presents views and functionality familiar to operators and administrators alike in a platform that accurately simulates the behavior of a specific plant.
Toxchem
Air Emissions and Contaminant Fate
Toxchem is the most reliable and user-friendly software solution for estimating and reporting air emissions and contaminant fate during wastewater collection and treatment.
CapdetWorks
Preliminary Plant Design and Costing
Start with CapdetWorks for reliable and comprehensive wastewater plant design and costing. Simplify examination of capital and operating costs, compare treatment alternatives and perform life-cycle analyses.
WatPro
WatPro is the premier water treatment simulator for predicting water quality based on specific treatment processes and chemical addition.
GPS-X / SimuWorks
- Windows 10 / Server 2016 / Server 2019 (64 bit)
- 3 GHz processor
- 8 GB of RAM
- 2 GB of free disk space
Toxchem / CapdetWorks / WatPro
- Windows 8 / 10 / Server 2016
- 4 GB of RAM
- 500MB of free disk space
| GPS-X | CapdetWorks | Toxchem | SimuWorks | WatPro | |
| PROCESS DESIGN | |||||
| Preliminary Plant Design | V | V | |||
| Detailed Plant Design & Sizing | V | V | |||
| Process Control & Optimization | V | V | |||
| Process Technology Evaluation & Comparison |
V | V | V | V | |
| Aeration System Sizing | V | ||||
| Biosolids Pretreatment | V | ||||
| Nutrient Removal & Recovery | V | V | V | ||
| Co-Digestion & Biogas Generation | V | V | |||
| GHG Footprint, Energy Optimization | V | V | V | ||
| Limit of Technology Evaluation | V | V | V | ||
| Drinking Water Treatment Process Modeling | V | V | |||
| Compliance & Risk Assessment | V | V | V | V | |
| Disinfection – Water & Wastewater |
V | V | |||
| AIR EMISSIONS MODELING | |||||
| VOC & Air Emission Modeling | V | ||||
| Contaminant Fate Estimation | V | V | |||
| Regulatory Reporting (NESHAP) | V | ||||
| COSTING | |||||
| Life Cycle Analysis | V | V | V | ||
| Life Cycle Cost Analysis | V | V | V | ||
| Capital Cost Estimation | V | ||||
| Operating Cost Estimation | V | V | |||
| Plant Layout & Process Flow Diagrams | V | V | V | V | V |
| OPERATIONS & TRAINING | |||||
| Operator Training & Knowledge Management | V | V | |||
| Customized Facility Interface (3D & SCADA) |
V | ||||
| Dynamic Data Exchange | V | V | |||
| Online Disinfection Management | V | ||||


