
最新版 Highcharts v11 更新於 2024/8/29
最新版 Highcharts Stock / Highcharts Maps v11 更新於 2024/8/29
線上服務 everviz (原為 Highcharts Cloud) 隨時更新

Highcharts 是一個製作圖表的 Javascript 類庫,提供簡單的方法讓您添加互動式圖表到您的網站或是Web應用程序。Highcharts目前可製作的圖表有:直線圖、曲線圖、區域圖、區域曲線圖、直條柱狀圖、橫條柱狀圖、圓餅圖、散狀圖等等。
最新版本已經發布了Highcharts最常被詢問的功能-圖表存取和輸出。隨著新版本的發行,您可以在您的圖表添加輸出按鈕,並讓你的用戶下載你的圖表,格式有PNG、JPG、PDF或SVG。
輸出模塊是由一個伺服器後端執行的,不論是Highslide Software的免費網路服務,或者是主機可以安裝在他們自己的伺服器的一個伺服器模塊。
輸出是可能的,因為在Hightcharts有全新的以SVG為基礎的渲染層。在SVG渲染器的最上層是IE瀏覽器的VML渲染器。當輸出的時候,所有的瀏覽器將恢復到SVG渲染器,並且發送SVG圖表報告給伺服器,伺服器將會把它轉換為其它圖像格式。
新的模式也意味著在IE瀏覽器有更好的性能。在IE裡面,圖可以畫的比以往更快,而且有更多點的執行會使得差異更大。
SVG模式的另一個好處是在標準兼容瀏覽器中減少記憶體使用量。雖然在版本1中的多個畫布將消耗大量的記憶體,但在第2版SVG就大大減輕記憶體的負荷了。
產品特色
 |
兼容 可以運作在任何瀏覽器中,包含iPhone / iPad和Internet Explorer 6以上的版本,其在標準瀏覽器中使用SVG圖形渲染;而在Internet Explorer中使用VML圖形繪製。 |
|
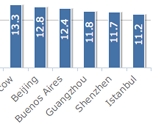
標籤文字旋轉 所有的文字標籤,包括軸標籤、數據標籤點和軸標題,可以進行任意角度的旋轉。 |
 |
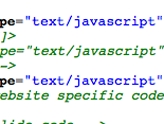 |
JavaScript技術 Highcharts基於原始瀏覽器技術,不需要Flash或Java插件。甚至您不需要在任何服務器上安裝,且不用使用PHP或ASP.NET。Highcharts只有兩個JS文件就能運行。 |
|
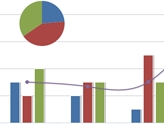
眾多的圖表類型 Highcharts支援線狀圖、樣條圖、面積圖、柱形圖、條形圖、圓餅圖和散點圖類型。任何一個都可以在圖表中相結合。 |
 |
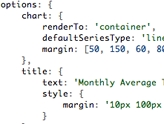 |
簡單配置語法 設置Highcharts配置選項,並不需要特殊的編程技能。產品給出一組JavaScript符號結構,基本上是一組由冒號連接,用逗號隔開以及用大括號分組。 |
|
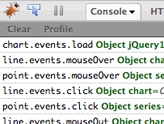
動態 透過一個完整的API,你可以在建立圖表後的任何時間添加、刪除和修改圖表、軸或點。無數事件編程讓用戶對使用chart反感。結合使用jQuery或MooTools的AJAX API,將提供給您解決方案,其可以不斷即時更新從伺服器、用戶提供的數據和更多來源。 |
 |
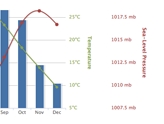 |
多軸發展 有時你想比較不同規模的變量-例如溫度相對於降雨量和空氣壓力。如果你想比較不同類別的數據,Highcharts可以讓你指定每個系列的Y軸或x軸。可以設定放在圖表的左側或右側,頂部或底部,所有的選項都可以單獨設置。 |
|
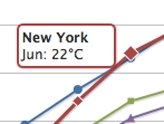
工具提示標籤 Highcharts可以顯示數據的詳細訊息在每個節點和系列。當用戶在圖表上移動滑鼠,可以使用本功能以標籤其中的資料點,這可以用戶更容易閱讀的所標示的點與另一個點的關係。 |
 |
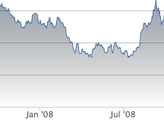 |
日期時間軸 有75%的XY圖表擁有日期時間的X軸。因此Highchart擁有智能的時間值設定。在毫秒的軸單位中,Highcharts可以確定在何處放置刻度,使其始終標誌著月或週、午夜和中午,或是一小時等。 |
|
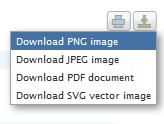
輸出和列印 用戶可以輸出圖表成為PNG、JPG、PDF或SVG格式,經由點擊一個按鈕。也可以直接從網頁列印圖表。 |
 |
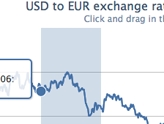 |
縮放 通過在圖表上縮放,您可以更加精確的檢查數據,尤其是資料有趣的部分。可以在X或Y軸中檢查或兩者兼用。 |
|
載入外部數據 Highcharts可以提取JavaScript陣列的數據,可以定義配置對象在一個單獨的文件、甚至在不同的網站。此外,數據可以用任何Highcharts形式處理,如回調函數用來解析一個數組中的數據。 |
 |
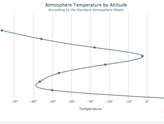 |
倒置圖表或扭轉軸 有時您需要翻轉你的圖表,例如讓條形圖的X軸變成垂直。此外也有支援扭轉軸的功能。 |
Highcharts Stock (原為 Highstock) 讓您建立股票圖或一般的時間圖表在 JavaScript 之中,包含先進的導航選項,就像一個導航系列、預設日期範圍、日期選擇、滾動和平移。
產品特色
Highcharts Stock Features
40+ Tech indicators
Including SMA, MACD, CCI, RSI, Stochastic, Bollinger Bands, Pivot Points, PSAR, and Ichimoku Kinko Hyo. Check out the demo.
Data grouping
Group data into optional groups like days, weeks and months with Highcharts Stocks’ blazingly-fast data grouping feature.
Navigation For Finance
Includes small navigator series, preset date ranges, date picker, adjustable panes, scrolling and panning.
Secure
Use Highcharts Stock on your intranet or password protected websites without worrying about anyone siphoning your data.
Stock Tools
Analysts and end-users can annotate and apply statistical calculations on any data-set without the aid of developers.
Includes Highcharts Core
The Highcharts Core library is also included, which provides an additional 30 different chart types.
Pivot Points
Visualize the momentum and trend of your data with pivot point indicators.
Cumulative Sum
The Cumulative Sum tool sums all the previous values with the current value in a visible range.
Highcharts Maps (原為 Highmaps) 提供了一種基於標準的方法,用於在基於Web的項目中生成邏輯示意圖。它擴展了用戶友好的Highcharts JavaScript API,允許Web開發人員構建交互式地圖,以顯示銷售,選舉結果或與地理相關的任何其他信息。
Highcharts Maps 基於Highcharts,這是一個基於SVG的多平台圖表庫,自2009年以來一直在積極開發。它可以輕鬆地為您的Web和移動項目添加交互式,移動優化的圖表和地圖。
各種地圖類型
地圖區域,地圖線,興趣點,地圖上的氣泡,熱圖。
響應和移動準備
智能地適應任何設備並支持多點觸控手勢。
GeoJSON支持
除了常見的Series / Point概念,Highcharts Maps 還接受標準化的GeoJSON格式進行地圖輸入。
特色
Highcharts Maps Features
Map Collection
We provide a collection of hundreds of maps, all optimized for fast download and rendering with Highcharts Maps. The map collection is also available via NPM.
Built-in Projections
Highcharts Maps includes some basic built-in projections, and other projections can be custom built and plugged in.
Color Axis
Control the color layout of Highcharts Maps choropleth maps in a separate color axis with common options like min, max, logarithmic scale and more.
Custom Maps
Create custom maps using SVG, such as this regular map of a made-up place, or this irregular map of a real place.
Map Types
Several map types are supported, including map area, map line, points of interest, bubbles on maps, heatmaps and tilemaps.
Map Navigation
Navigate Highcharts Maps with plus/minus buttons, doubleclick to zoom, mousewheel zooming, multitouch and panning.
Includes Highcharts Core
The Highcharts Core library is also included, which provides an additional 30 different chart types.
Temperature Map Series (coming soon)
Use the temperature map series to highlight areas of your map detailing the density or severity of the data.

Highcharts Gantt
Highcharts Gantt 提供了一個基於標準的方法,用於在基於 Web 的項目中生成先進的甘特圖。它使 Web 和移動開發人員能夠生成用於分配和協調活動與資源的互動式圖表。構建在領先行業的圖表庫 Highcharts JS 之上。Highcharts Gantt 內建有有用的 GUI 增強功能,例如里程碑、完成百分比陰影、當前日期指示以及活動之間的關係。它充分利用了現代 Web 技術,為開發人員和最終用戶提供了可以輕鬆構建交互式圖表的體驗。
特色
Highcharts Gantt Features
Helpful Standard Features
Highcharts Gantt includes many advanced and useful features by default, such as Milestones, Percent-complete shadings, Current day indication, and Relationships between activities.
Multi-format Exports
Export Highcharts Gantt charts into multiple raster or vector graphics formats. Perfect for including the charts in static reports and presentations.
Interactive
Drag and drop objects to change their duration and order. The API also allows user-manipulation of the GUI to be written back to the server.
Developed with Clients
Highcharts Gantt was developed and quality-controlled in close dialogue with clients who were unable to find existing market solutions that met their needs.
Use Cases
Gantt charts are great for any kind of asset allocation or scheduling, from reserving meeting rooms at work to keeping track of the kids’ after-school activities.
Includes Highcharts Core
The Highcharts Core library is also included, which provides an additional 30 different chart types.
Gantt Axis Grid
The grid axis makes it easy to display task information in table form.
Dependencies Between Tasks
Configure dependencies between tasks to visualize the work breakdown structure of a project .
| Internal | SaaS | OEM | |
| Usage | |||
| Internal Use | V | V | V |
| SaaS and Web Applications | 1 | V | |
| Customer Installations (OEM) | V | ||
| Charting | |||
| Highcharts Core | V | V | V |
| Highcharts Stock | 詳情 請洽詢友環業務 | V | |
| Highcharts Maps | V | ||
| Highcharts Gantt | V | ||
| Dashboard | |||
| Highcharts Dashboards | 詳情 請洽詢友環業務 | V | |
| Integrations | |||
| Python | 詳情 請洽詢友環業務 | V | |
| Highcharts Advantage | |||
| Releases | V | V | V |
| Technical support | V | V | V |
