HttpWatch 是強大的網頁數據分析工具。集成Internet Explorer和Mozilla Firefox並提供無與倫比的HTTP監測水平,不需要單獨配置的代理伺服器或網路嗅探器。簡單的與網站互動,HttpWatch可以將顯示沿著網頁本身的響應和請求的日誌。它甚至可以顯示瀏覽器和它的高速緩存之間的相互作用。每一個HTTP記錄都可以詳細的分析其Cookies、消息頭、字符查詢等和HTTP相關的信息,分析報告輸出為XML、CSV等格式。
商業網站經常使用諸如HTTP壓縮,SSL加密技術和區塊編碼,以提供安全性和性能的最好水平。 HttpWatch擁有這些技術,提供在Internet Explorer中的HTTP活動的詳細信息視圖。
如果您的網頁經常加裝很多外掛在自己的部落格上,因為這些外掛大多屬於「外部連結」,一旦讀取速度卡住時,就很難去判斷是哪些外掛服務影響到你的網頁載入速度,利用此工具的HTTP連線分析、網站測速,不僅可以估算出回應的時間,還可以幫你揪出問題點!
HttpWatch還可以檢測網頁每一個元件的回應速度、連結連線狀態、檔案類型,特別是加裝很多網路工具在網站上的人來說,特別需要了解哪些加裝上去的網站服務可能是拖慢網頁的兇手,如果太過慢速的服務就可以考慮取捨,對於網頁設計人員來說也可以藉此來調校優化網頁。
所有Web應用程式廣泛使用的HTTP協議(HTTPS安全站點)。即使是簡單的網頁,都需要使用多個HTTP請求下載HTML,圖形和javascript。查看瀏覽器和網站之間的HTTP交互的能力,要執行web開發,這些功能是至關重要的:
- HttpWatch整合Internet Explorer和Firefox瀏覽器,當你存取一個網頁時,顯示您的HTTP流量,包括網頁摘要,Cookies管理,緩存管理,消息頭發送/接受,字符查詢,POST 數據和目錄管理功能,報告輸出。
傳統的網路監測工具只能顯示從網路上捕獲的低水平的數據。相比之下,HttpWatch可以顯示優化的HTTP流量,使您可以快速看到消息頭,cookie,查詢字符串,及其他更多功能。 - HttpWatch可以同時支援非交互式檢查HTTP數據。當日誌文件被保存時,一個完整的HTTP流量記錄將被保存在一個文件夾。你甚至可以檢查您的使用該軟體之客戶和供應商的日誌文件。
- 如果你訪問一個網站,使用安全的HTTPS連接,HttpWatch可以自動顯示網路流量解密的形式。
更新介紹
Console Output Recording
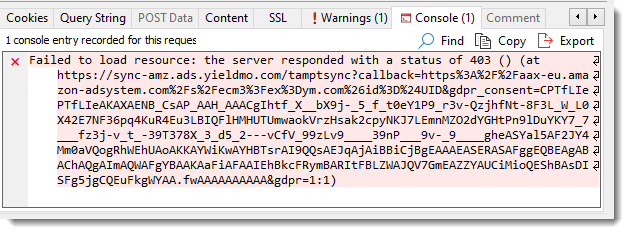
Console output from Edge and Chrome (version 64 onwards) is now recorded by HttpWatch. This includes logged error, warning and information messages and output from the JavaScript runtime such as syntax errors, exceptions and calls to the console.* API :
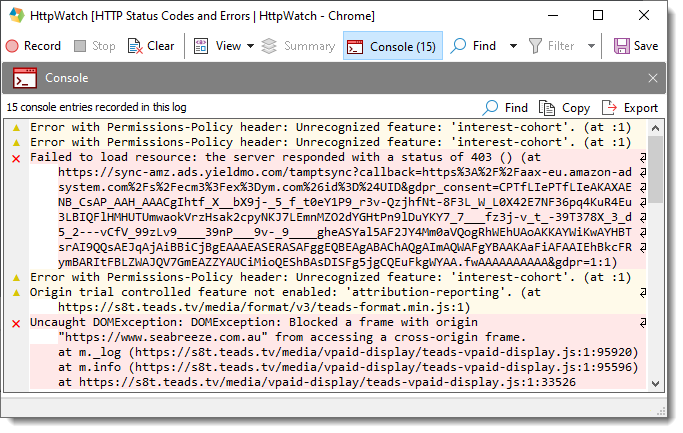
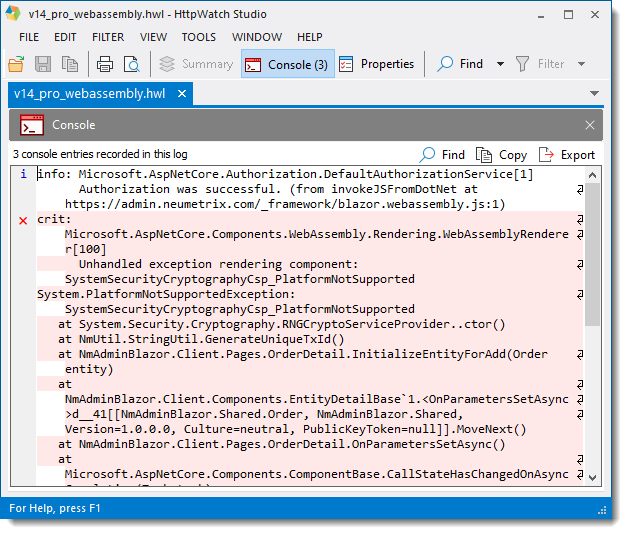
The console output from a browser can be essential for debugging client-side code in PWAs (Progressive Web Applications) that use large JavaScript libraries or WebAssembly hosted code (e.g. C#, C++ etc):
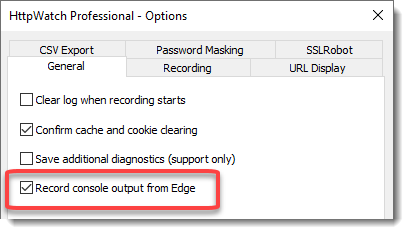
Console recording can be controlled from Tools->Options:
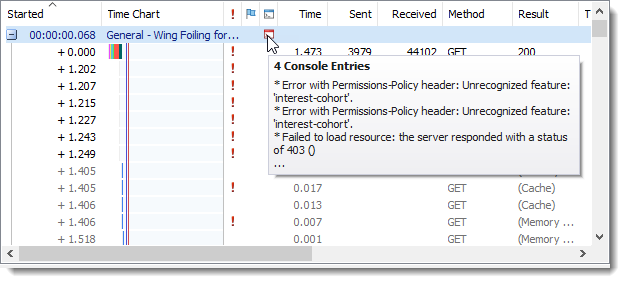
A new Console column shows whether console output was recorded for a page or request:
Console tabs show the console output associated with a selected page or request:
Updated User Interface
The HttpWatch UI has been updated with new flat look icons:
Seamless Web Page Debugging
HttpWatch integrates with Chrome and Internet Explorer browsers to show you the HTTP and HTTPS traffic that is generated when you access a web page.
Fast, Easy Access to Cookies, Headers & More...
Select a request in HttpWatch and everything you need to know is display in a tabbed window. Cookies, Headers, Query Strings and POST data can be quickly viewed, searched and exported to other formats.
Understand HTTP Headers Without Being An Expert
You don't have to be an HTTP expert or have read the HTTP RFC to understand headers. Simply hold the mouse pointer over a header and a data tip explains how it is used.
Handle Multi-Page Scenarios With Page Grouping
HttpWatch groups together requests within a heading for each page making it much easier to understand multi-page steps, e.g. log in, search and update pages.
Real Time Page Level Time Charts
Page level time charts are displayed and updated in real-time as you record requests in HttpWatch. This gives a direct, visual indication of how a site is performing - allowing common problems to be diagnosed at a glance.
Millisecond Accurate Request Timings
The time chart displayed for each request is broken down into a number of colored sections to show network level timings such as DNS lookup, TCP connect and SSL Handshake
Page Event Timings
HttpWatch is able to show browser event timings alongside the network level HTTP waterfall chart. Timings such as the Render Start and Page Load events are useful metrics for determining when content starts to be displayed and when the page appears to be complete.
Automatically Detects Performance Issues
Performance warnings are displayed when the speed of an HTTP request or resource download could be improved. The warning includes information about how the web server should be configured to avoid the issue.
Easy Setup - No Changes To Proxies, Drivers or Certificate Chains
Setting up HttpWatch just takes a few minutes. After running the install program simply open Chrome or IE and then confirm that you want to enable the HttpWatch add-on. HttpWatch can then be opened to view the network traffic for any web page.
Local admin rights are required to run the setup program but after installation HttpWatch can be used from non-admin accounts.
Hassle-Free Access To HTTPS Traffic
HttpWatch is able to display HTTPS traffic without having to decrypt it first because it is integrated within the browser. This means you don't need to have access to private keys or modify trusted SSL root certificates.
Full Support for IE 11, Windows 10, EPM and 64 bit
Depending on how you have setup Windows, IE 11 may be running in 64-bit mode and have Enhanced Protected Mode (EPM) enabled. HttpWatch supports these different configurations without any additional changes or reinstallation.
Check the SSL Strength Of HTTPS Connections
The SSL tab displays information about the type of certificates and encryption used to setup an HTTPS connection. Potential issues are highlighted as being of 'medium' or 'weak' strength'
Automatically Detects Security Issues
Warnings are displayed when a potential security issue is detected on an HTTPS page.
Verify That Headers, Cookies & Form Fields Are Used Correctly
HttpWatch shows you all the data that a secure web server delivers to the browser allowing you to check that sensitive field values and internal configuration details are not accidently exposed through the web interface.
Customers and Users Can Send You Log Files For Free
The free Basic Editions of HttpWatch for Windows and iOS allow anyone to send you a detailed HttpWatch log file (HWL) without having to make a purchase.
This feature is often used by software companies to diagnose issues that their customers have reported in their web based systems.
Passwords Are Masked in Log Files
A common problem with collecting HTTP trace files from customers or users is that the file may contain the password that was entered during login. HttpWatch is configured by default to mask out suspected password fields in submitted web forms.
HttpWatch Professional Unlocks Log Files From The Basic Edition
Log files recorded in HttpWatch Basic contain the same level of detail as HttpWatch Professional but only a limited amount of information is displayed by default. This information is available when you open the file in HttpWatch Professional.
Automate HttpWatch With Almost Any Programming Language
HttpWatch has an extensive automation API allowing it to be controlled from most popular programming languages - C#, Ruby, Python, JavaScript, etc.
Measure HTTP Performance and Detect Errors During Automated Testing
HttpWatch can be integrated with automated test frameworks for IE, such as Watir and Selenium so that you can detect HTTP level errors and performance issues during testing.
Automatic Recording
Log files can be collected without any programming by enabling the automatic recording and saving feature. This can be useful if you have users running manual tests and you need to keep a record of performance metrics and errors.
| Basic Edition | Professional Edition | |
| Demonstrates the capabilities of HttpWatch Professional and can be used to exchange HTTP log files with your customers and suppliers | The full unrestricted version of HttpWatch that can be used to view HTTP log files collected with the free Basic Edition. | |
| Chrome Extension | V | V |
| Edge Extension | V | V |
| Internet Explorer Add-on | V | V |
| Standalone log file viewer | V | V |
| Shows HTTPS requests | V | V |
| Page Level Time Charts | V | V |
| Request Level Time Charts | V | V |
| Automatic Recording | Requires user confirmation | V |
| Password Masking | V | V |
| Exports to CSV, HAR and XML | For restricted set of URLs only* | V |
| Displays basic HTTP information including URLs, status codes, response size, mime type & time | V | V |
| Displays detailed HTTP information including headers, cookies, streams, compression, etc... | For restricted set of URLs only* | V |
| Saves full trace file | V | V |
| Loads and displays trace files recorded in HttpWatch Professional Edition | V | V |
| Loads and displays trace files from HttpWatch Basic Edition | Detailed information only displayed for certain URLs* |
V |
| Automation Support (Chrome, Edge and IE) |
Detailed information only displayed for certain URLs* |
V |
| Printing and Print Preview | A banner about HttpWatch is display at the top of every |
V |
* Certain functions in HttpWatch Basic Edition are restricted to sites in the Alexa Top 20 or one of the following - amazon.com, ebay.com, httpwatch.com & slashdot.org
For Windows 10 or later and Server 2016 or later
Supports: Google Chrome 103+ and Microsoft Edge 103+


