
最新版 LightningChart .NET v.12 更新於 2024/10/10
最新版 LightningChart JS v.6.0 更新於 2024/8/6

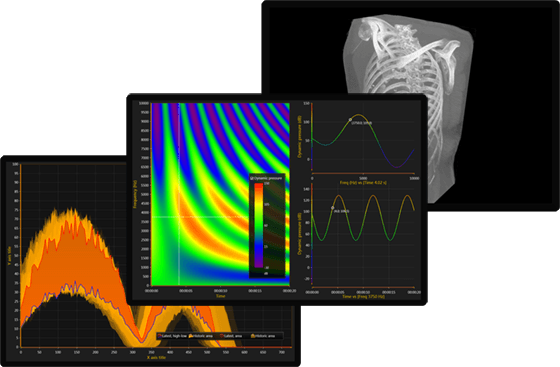 LightningChart for .NET 圖表工具/圖表控件
- WinForms 和 WPS 繪製 2D 和 3D 資料視覺化功能強大 SDK
- 新版 GPU 加速的函式庫,大量資料也可快速繪製漂亮圖表
- 支持 Windows 11
- 需安裝 .NET framework v4.0 或更新版本
LightningChart 業界最快速 、最先進的圖表控件,支援 WPF 和 WinForms
由芬蘭控件開發公司 Arction 開發的 LightningChart 圖表控件徹底發揮了 GPU 加速和性能優化的最大效益,能即時呈現龐大資料,廣泛應用於科學研究、工程、醫療、航空、貿易、金融、能源等領域做即時測量和分析應用等等。
專門為需要超高速資料獲取與呈現即時資料的專業高速軟體而特別設計。圖形採用創新的CPU負載節省技術與高效利用記憶體資源,為應用程式提供了無與倫比的性能:
- 即時監測中無閃爍或延遲現象
- 高解析度資料集
- 強交互性
- 有效利用技術資源
- 運用較舊的電腦硬體也可以保持上述的優點
高性能
徹底發揮了 GPU 超速和 DirectX 底層性能優化來呈現大數據,並確保最高性能
高靈活性
- 為高難度行業提供完全自訂工具和成百上千種圖表
- 通用功能
- 全方位的滑鼠交互,支援觸屏,自訂滑鼠交互擴展
- 游標注釋,調色版著色資料,完全自訂群組件
- 在選定的系列類型中,通過 NaN或指定的分隔值斷開資料
- 使用數位、時間、日期、對數、地理坐標系和自訂軸刻度
- 成百上千種圖表
- 頂級技術支援
- 渲染技術
- 支持 DirectX 11 與 DirectX 9
- 系統中 WARP 自動渲染軟體,無需獨立顯卡
- 可選字體品質
- HiDPI 縮放支持
- 支援運行於 32 位元和 64 位元系統模式
- 與 Visual Studio 2022 和 .NET 6 完全相容
系統需求
System requirements
Check if the computer configuration meets the requirements
– DirectX 9.0c (shader model 3) level graphics adapter or newer, or DirectX11 compatible operating system for rendering without graphics hardware. DirectX11 compatible graphics hardware recommended.
– Windows Vista, 7, 8, 10 or 11, as 32 bit or 64 bit, Windows Server 2008 R2 or higher.
– Visual Studio 2010-2022 for development, not required for deployment. NOTE, for several latest LightningChart versions at least Visual Studio 2022 is required, because .NET Framework 4.6 and above is used. Visual Studio 2022 is required for .NET (5, 6, 7, 8) projects.
– .NET framework v. 4.0 or newer installed. NOTE, only LightningChart version prior v10.0.1 was targeting .NET Framework 4.0. For later versions target .NET Framework version was increase, and LightningChart v11.0.1 already target .NET Framework 4.8.
.NET compatibility
Before LightningChart version 11.0.1 it was built primary for .NET framework, but is also compatible with the following .NET versions:
– .NET Framework 4.x
– .NET Core 3.0 and 3.1
– .NET 5
– .NET 6
– .NET 7
– .NET 8
Staring from LightningChart version 11.0.1, library is build targeting .NET Framework 4.8 and .NET 6.0. Project's (where library will be used) build target framework should be the same or higher.
TIP
.NET application can use libraries build for .NET Framework as well as .NET. When using the .NET Framework targeting library in .NET application, Visual Studio may give a warning about installed package using different target, especially when using NuGet packages. However, this does not prevent the application from working. In these cases, the warning can be suppressed or just ignored.
WARNING
Currently Visual Studio (2022 17.8) does not support Controls/Toolbox Deployment through DLL-reference for .NET (5, 6, 7, 8) projects. Therefore, LightningChart .NET 6.0 controls could not be installed same way as for .NET Framework and LightningChart controls will not appear in Visual Studio toolbox in .NET Core 3.x, .NET 5, .NET 6, .NET 7 or .NET 8 projects.
This is not LightningChart specific, and effect any custom-control. Probably Microsoft Visual Studio dev. team will fix it in the future. However, this limitation does not prevent LightningChart control usage - user just need to add references manually and create chart in the code.
Dependencies
LightningChart is mostly self-contained package. There are only few dependencies, which should be added in few specific projects.
.NET 6.0 targeting DLLs
If DLLs used in the project was build targeting for .NET 6.0 (e.g. LightningChart.WinForms.Charting.NET6.dll or LightningChart.WPF.Charting.NET6.dll), then user should add System.Drawing.Common (>= 7.0.0) in the project.
UWP projects
For UWP project and edition of LightningChart library user should add in the project following packages:
– Microsoft.NETCore.UniversalWindowsPlatform (>= 6.2.13)
– Microsoft.Toolkit.Uwp (>= 7.1.2)
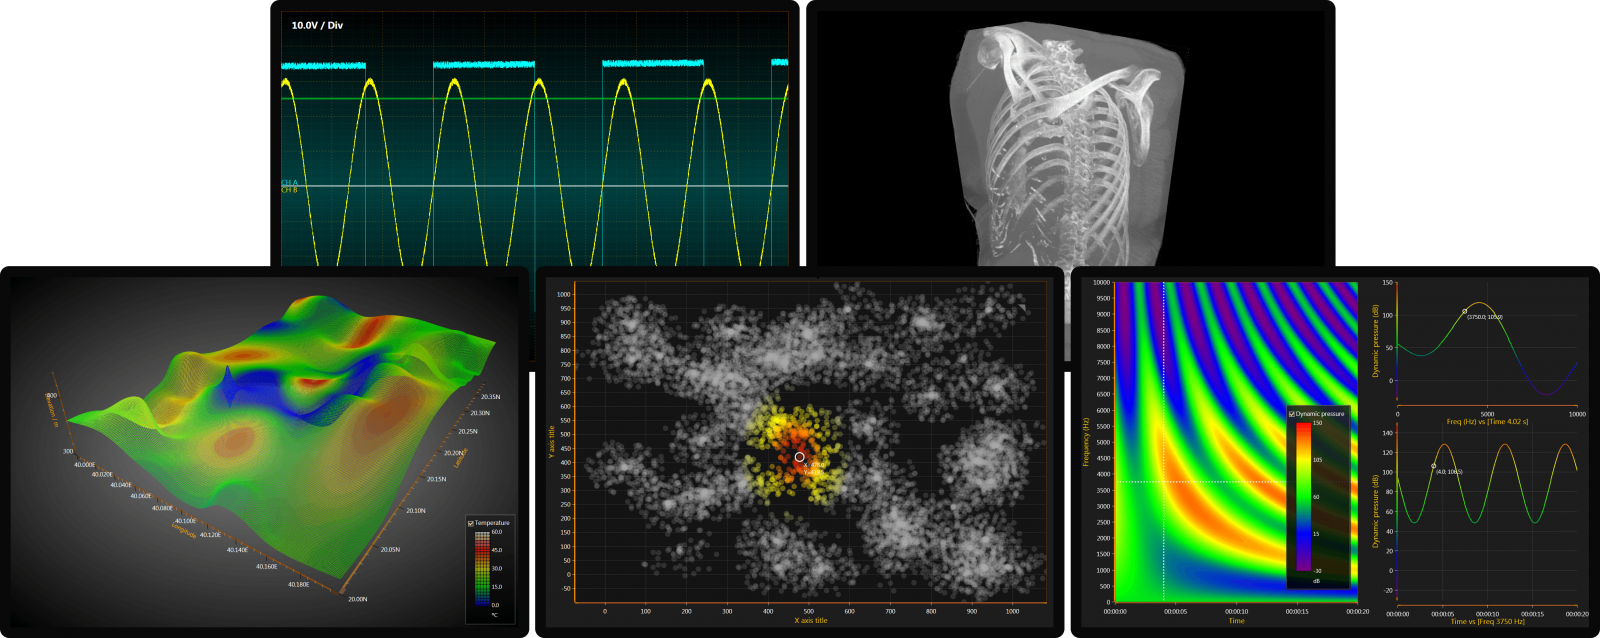
LightningChart 主打 7 種特色功能圖表:XY、3D 、Polar、Smith、Maps、Signal Tools、Volume Rendering。
LightningChart 7 個特色功能圖表可分開單個購買,
也可以套裝方式選購:Bronze、Silver、Gold 和 Platium ,歡迎來信洽詢產品資訊。
These following Features can be purchased separately:
- XY
- 3D
- Polar
- Smith
- Maps
- SignalTools
- Volume Rendering
|
|
||||||||||||||||||||||||||||||||||||||||||||||||||||||
Key Features
XY charts
The most definitive 2D cartesian chart, with the best rendering performance in the industry. Visualize your complex and huge data sets, with our optimized series types, shared X axes, built-in real-time scrolling modes and industry leading configuration options.
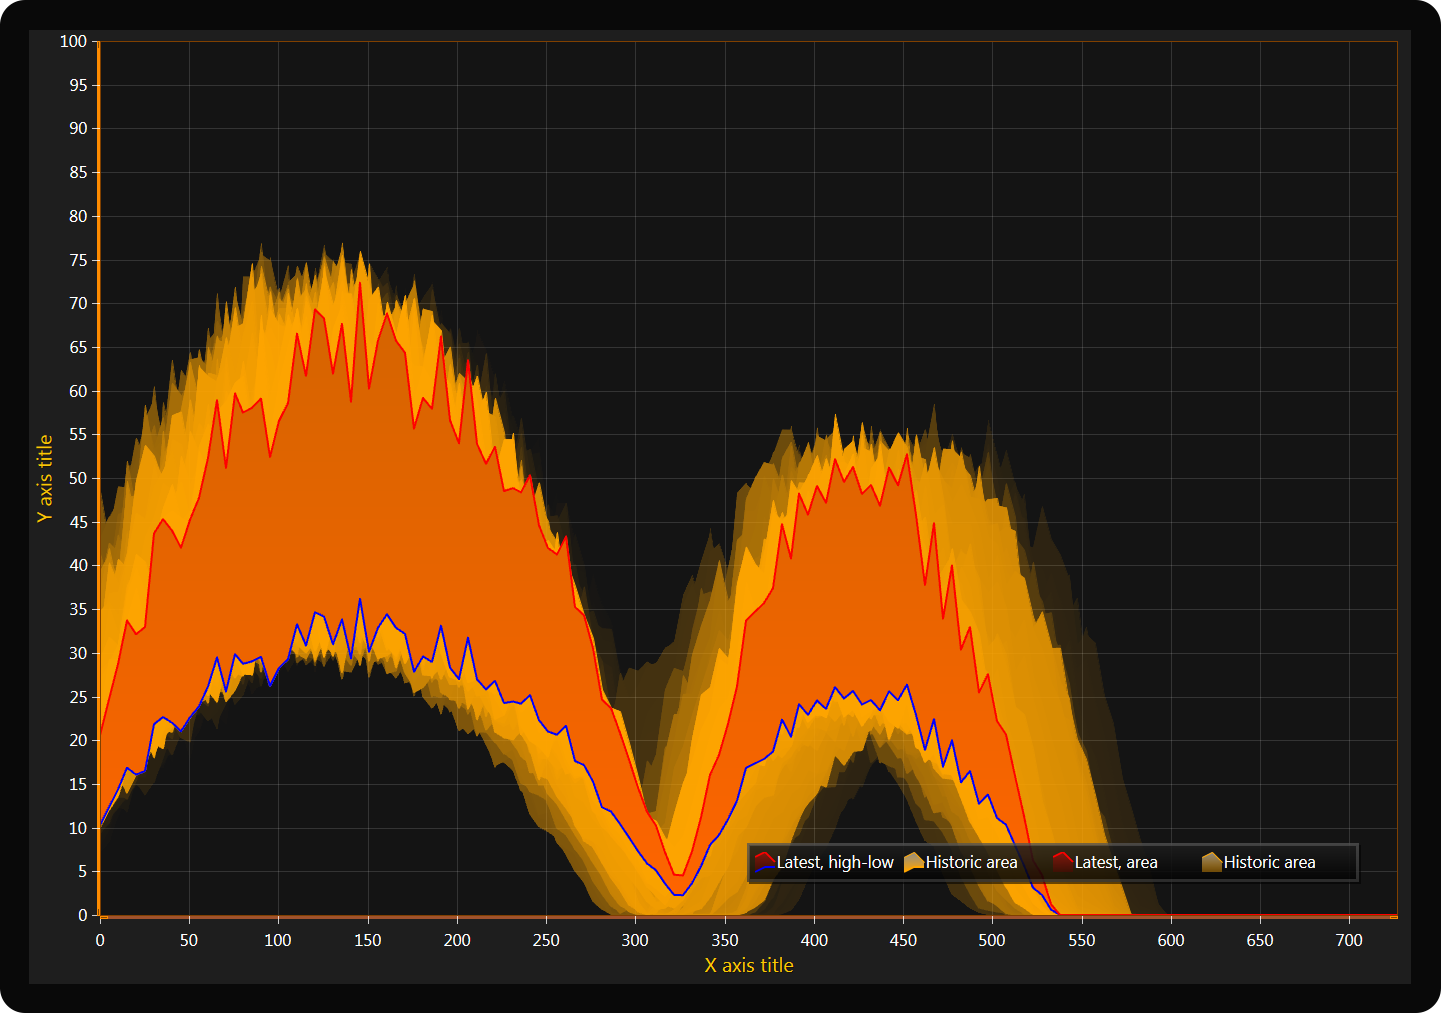
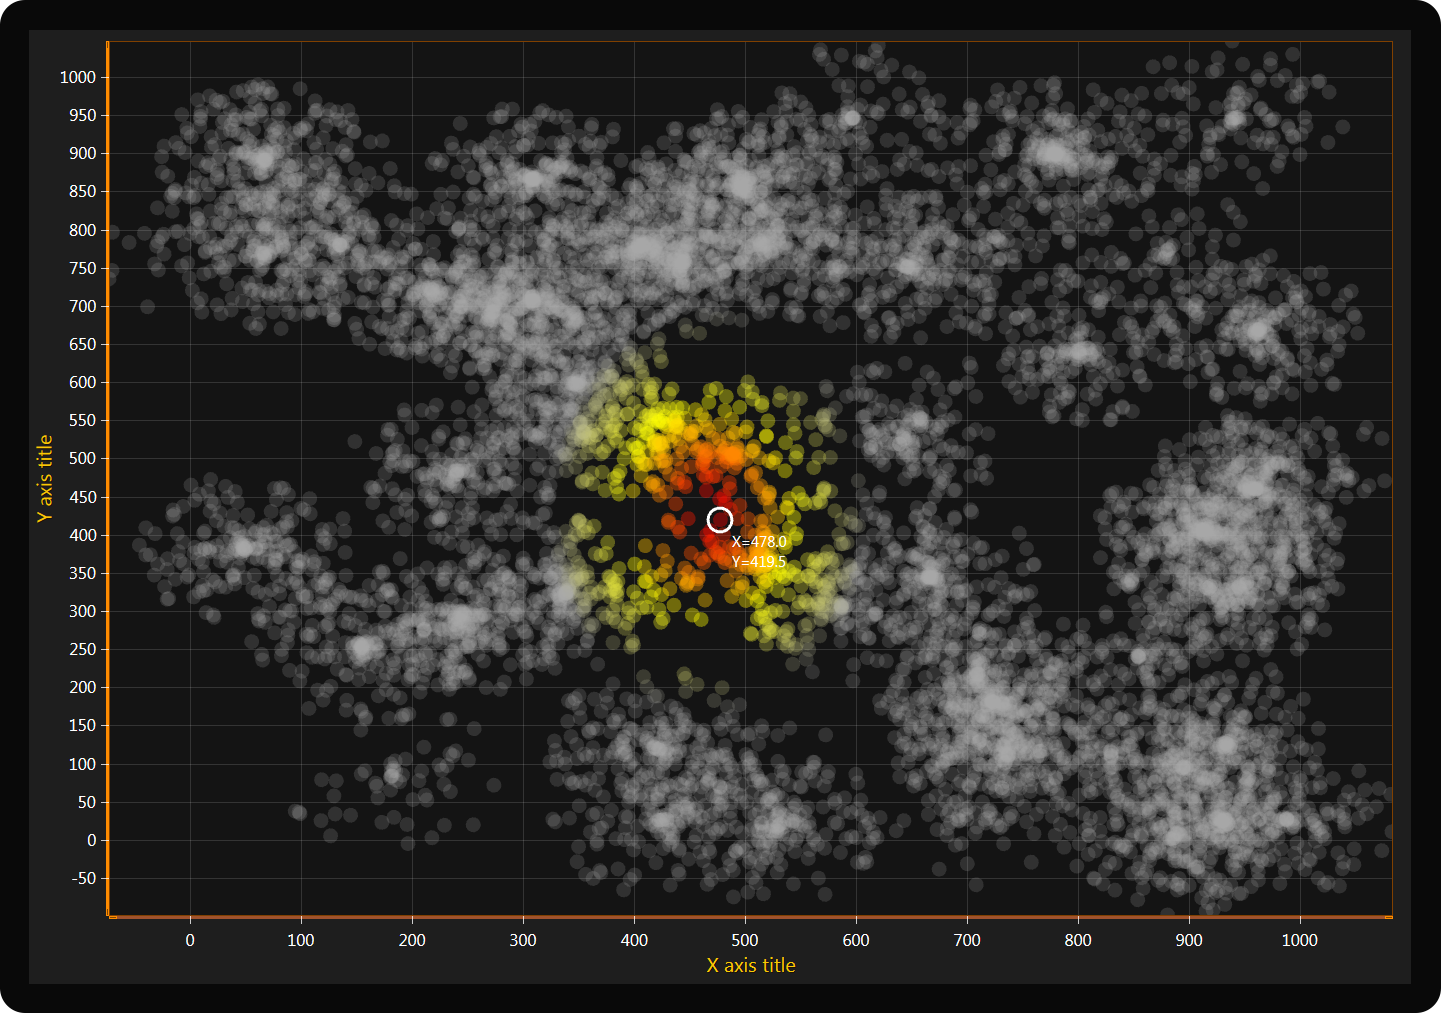
- Series types: sampled data (discrete signal), line, scatter points, point-line, freeform point-line, areas, high-low, polygon, stock (OHLC, candle-stick), bar, band, constant line, intensity grid, intensity mesh
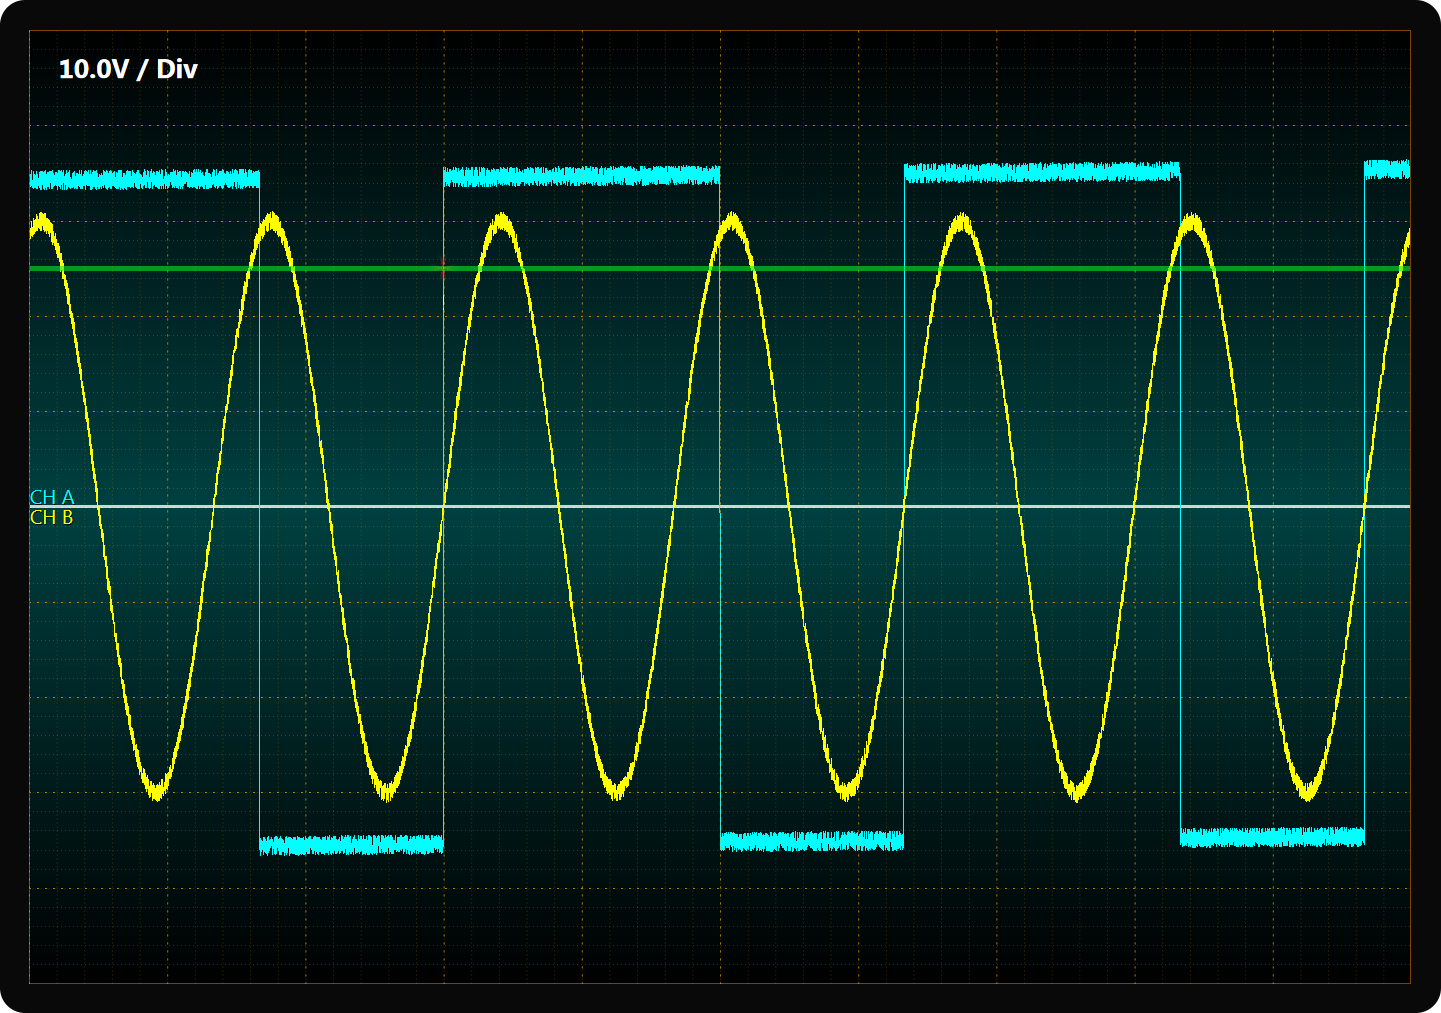
- Real-time monitoring scrolling modes: scrolling, sweeping*, stepping, oscilloscope style level triggered
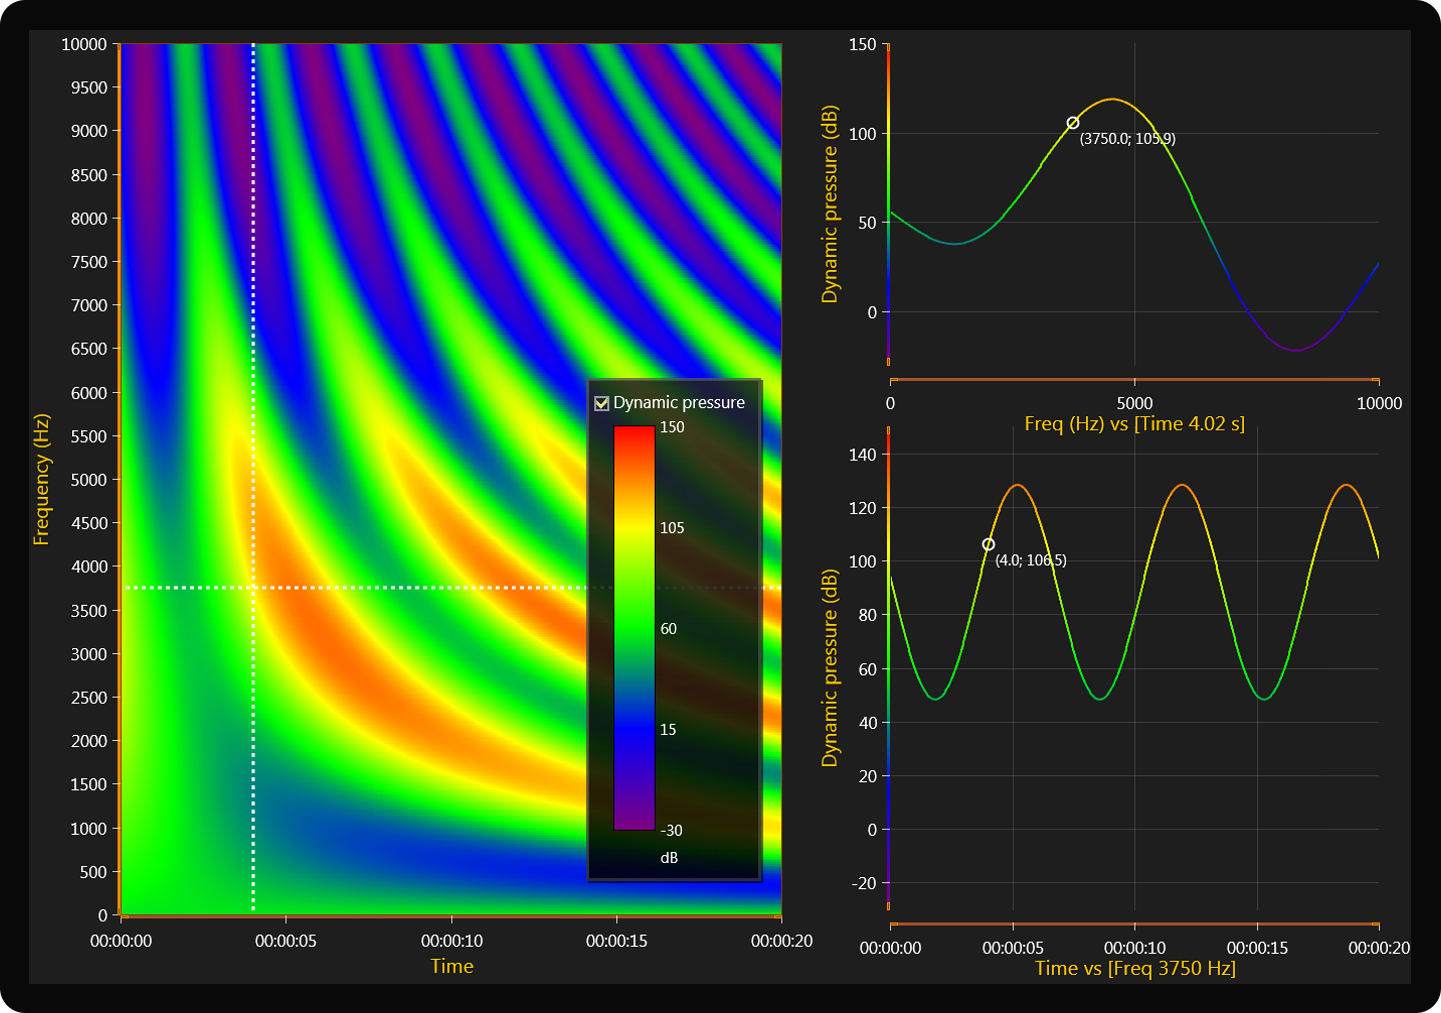
- Heatmaps with contours, wireframe, contour labels
- Stencil for rendering intensity series inside polygon, map region
- Annotations, markers, data cursors
- Persistent rendering layers
- Several legend boxes in the same chart
- Linear and logarithmic axes, X axis scale breaks
- Several configurable vertical segments in chart, layered / stacked
- Dozens of properties to control zooming and panning behavior
- * sweeping mode as built-in, no other charting provider has this.
Why LightningChart .NET?
LightningChart .NET is the fastest 2D & 3D data visualization SDK for WPF, WinForms and UWP. It has been actively developed since 2009.
The charting library contains over 170 interactive charts with rich functionality that is suitable for the creation of applications within the most demanding industries: science and research, engineering, economics and finance, trading, medicine, energy, space and defense
High – Performance
Entirely GPU accelerated chart control with a full optimization towards performance of charting components. Data visualization SDK that’s developed for presenting massive amounts of data with a minimal flickering and delays.
Functionality
Wide range of 2D and advanced 3D charts for the most demanding industries. Fully customizable tools and flexibility for .NET developers with the most demanding applications.
Cost – Efficiency
Get the best value for your money. We provide the highest quality chart control and constantly strive to make it accessible for our customers.
LightningChart provides the following Signal Tools
SignalReader
SignalReader generates real-time data stream reading signal files in different formats: WAV (PCM), sid (biosignal file), ssd (LightningChart Ultimate Demo application sample data format). The playback can be automatically restarted with looping option.
AudioInput
Reads real-time sampled data stream from sound card line-in (using e.g. microphone) through DirectSound. The data can be forwarded to chart, AudioOutput or your own data target.
SignalGenerator
SignalGenerator is a multi-functional signal generator component. It allows combining different waveform types into single, real-time output signal. The waveform components can be set with a built-in user interface or by code.
SpectrumCalculator
Converts data between time domain and frequency domain using Fast Fourier Transform (FFT) algorithm in Digital Signal Processing (DSP).
AudioOutput
Allows real-time data stream playback via sound card line-out (using e.g. speakers) through DirectSound. The data can be fetched from SignalGenerator, SignalReader, AudioInput or other data source.
Signal Filters
Efficient computation classes for Finite Impulse Response (FIR) and Infinite Impulse Response (IIR) digital signal filtering. Enables filtering out unwanted signal frequencies. Use any external filter design tool to supply the factors.
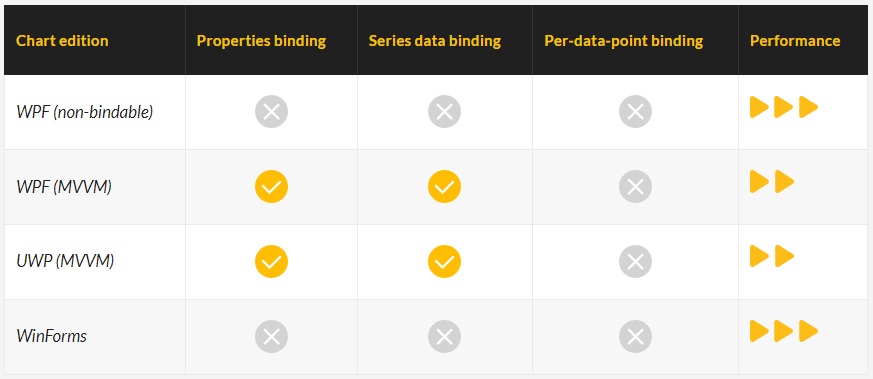
圖表版本
LightningChart組件在WPF種有不同的binding綁定版本,以應對不同的性能要求和MVVM(模型-視圖-視圖模型)可綁定的需求。
一般來說,Arction建議使用Semi-bindable半綁定API。
為了獲得WPF的最佳性能和多線程優勢,Arction建議使用Non-Bindable不可綁定圖表。
圖表繪製
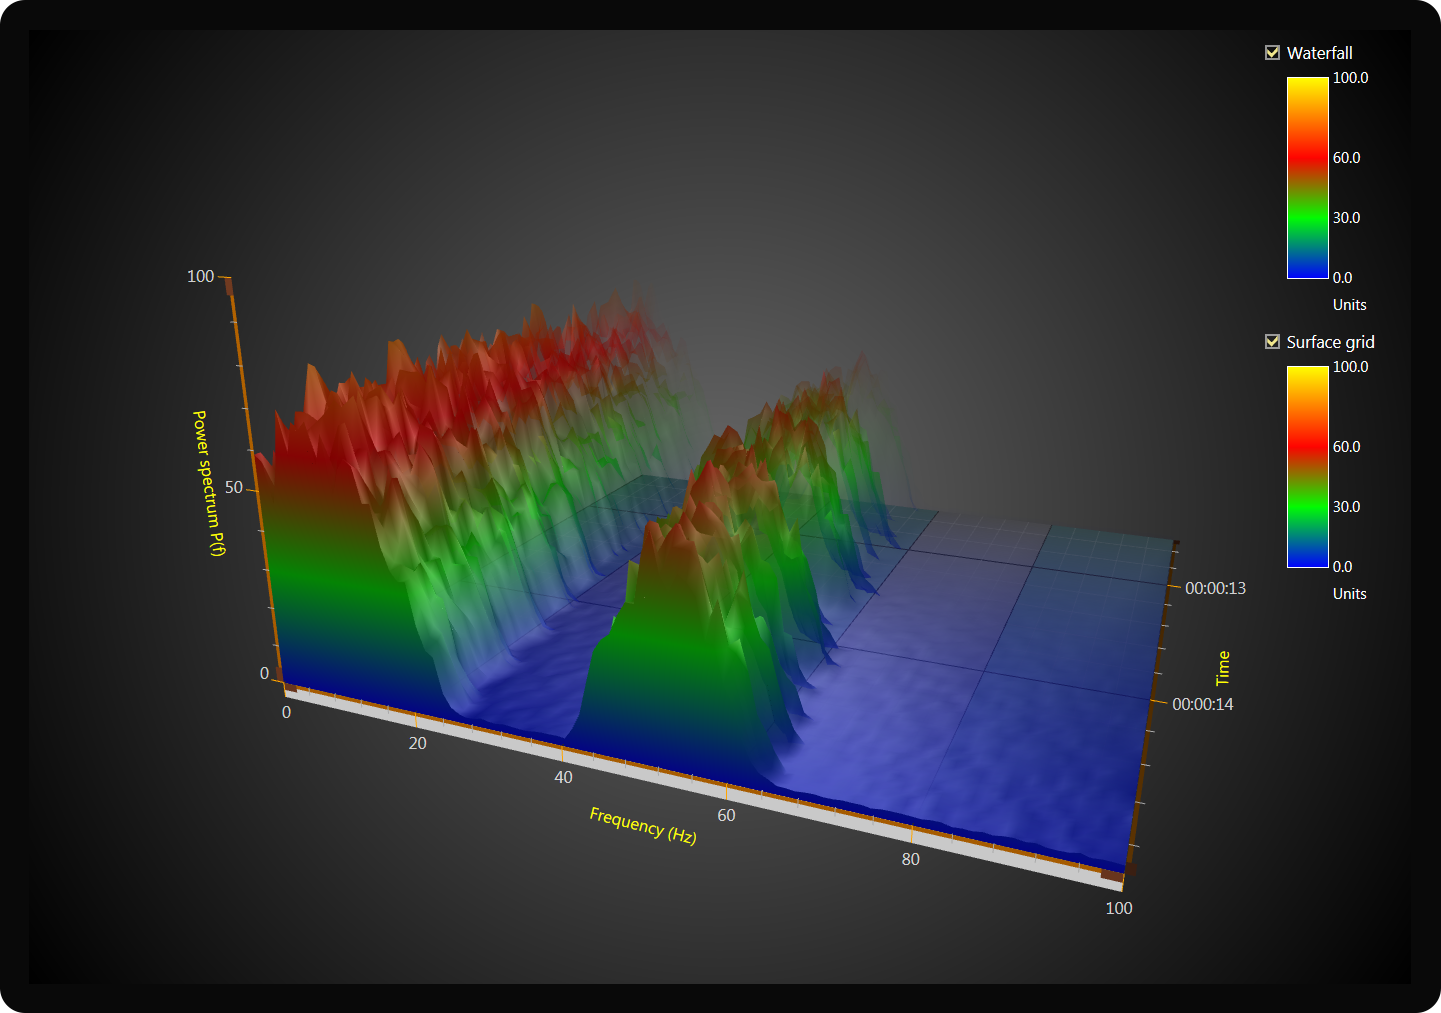
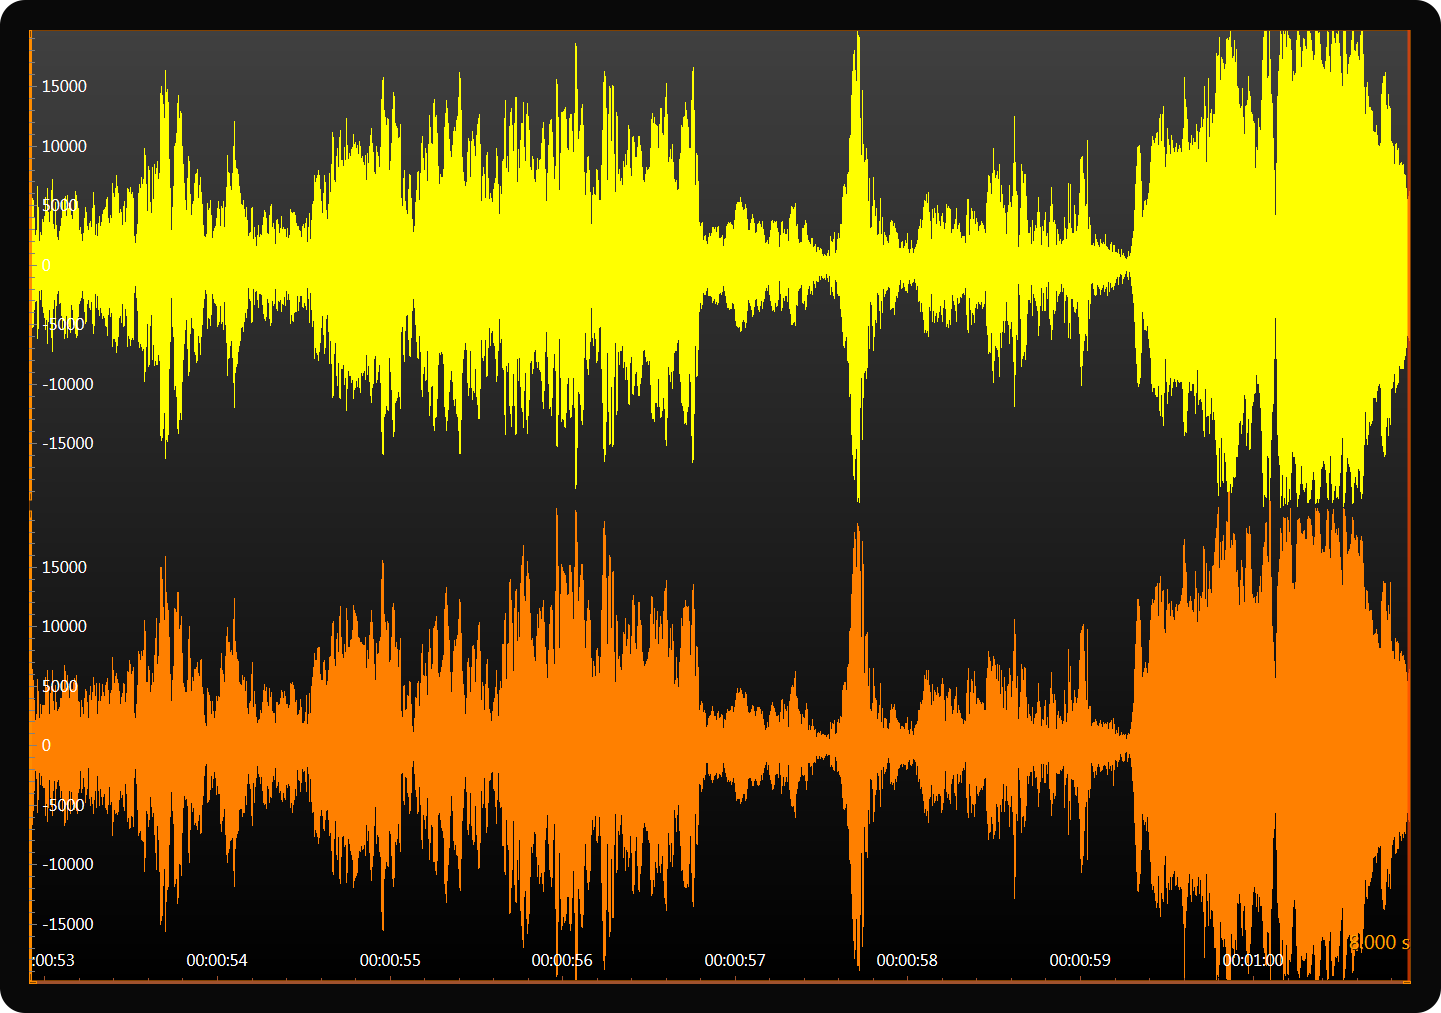
LightningChart JS
Web上性能最高的圖表庫
LightningChart JS具有出色的執行性能 - 使用高數據速率同時監控數十個數據源。
GPU加速和WebGL渲染確保您的設備的圖形處理器得到有效利用,從而實現高刷新率和流暢的動畫。
LightningChart JS極其強大的渲染功能可確保流暢的動畫超出所有行業標準的每個圖表數據量。圖形庫提供直觀的觸摸屏交互,包括縮放,平移,移動數據光標等。
儀表板控件使管理數十個圖表,圖例框,按鈕,複選框和其他UI元素變得簡單方便。儀表板在單個GPU場景中以資源有效的方式呈現,這也使得非常快速地調整列和行的大小。
LightningChart JS股票交易圖
股票交易圖實時數據來自worldtradingdata.com,包括以下特徵:
- OHLC數據
- 指數移動平均值
- 簡單移動平均值
- 布林帶
- 交易量
- RSI指標
高性能Javascript WebGL圖表
LightningChart JS是基於WebGL的跨平台圖表控件,應用於網站開發,軟件開發,物聯網,工程工業,商業交易等領域。LightningChart JS擁有優越的渲染性能,從而確保高刷新率和平滑流暢的動畫效果。同時具有可訪問的API在線文檔,廣泛的功能和自定義的插件等等。
操作界面
方便易操作,可管理數十種不同的圖表,插件等其他UI元素。GPU加速高效利用計算機資源,能夠高效地渲染圖表
動畫
強大的渲染功能確保動畫流暢顯示,該方面已經超過行業標準。直觀的觸屏交互功能,可以隨意放大,平移,移動光標
WebGL 渲染
GPU加速和WebGL 渲染確保您設備上的圖形處理器,能被有效地利用, 徹底發揮高刷新率和傑出的運行性能
Server side rendering
LightningChart JS現也支持客戶端渲染Server side rendering。這個功能可以可與npm中可用的包一起使用。客戶端渲染可以生成高質量的圖表圖像。
系統需求
Software
Compatible web browsers tested by Arction Dec 2018:
Google Chrome, Mozilla Firefox, Microsoft Edge, Safari, Opera, Yandex, Baidu, Maxthon, Sogou, 360 chrome, QQ, Liebao / Cheetah
LightningChart JS from v2.0.0 onwards requires the following WebGL extensions to work properly:
ANGLE_instanced_arrays
EXT_blend_minmax
OES_element_index_uint
OES_standard_derivatives
OES_vertex_array_object
WEBGL_lose_context
Hardware
WebGL 1.0 compatible graphics hardware, with lately updated drivers/software
XY Charts
- Series types: Line and point series, area series, area range series, rectangles, ellipses, box-whisker and line segment series.
- Linear axes can be placed left/right/top/bottom and possibility to have several X and Y axes per chart.
- Scaling modes include fitting, Expansion, Progressive/ Regressive and Manual.
- Markers and data cursors have customizable shape and styles.
- Logarithmic Axes
- Can be used with Numeric TickStrategies as well as DateTime TickStrategies.
- Base number can be set per Axis by users.
- Available with XY charts, supported series types: Line, Point, PointLine, Step, Spline, Area, AreaRange, Rectangle, Segment.
Advanced 3D Charts
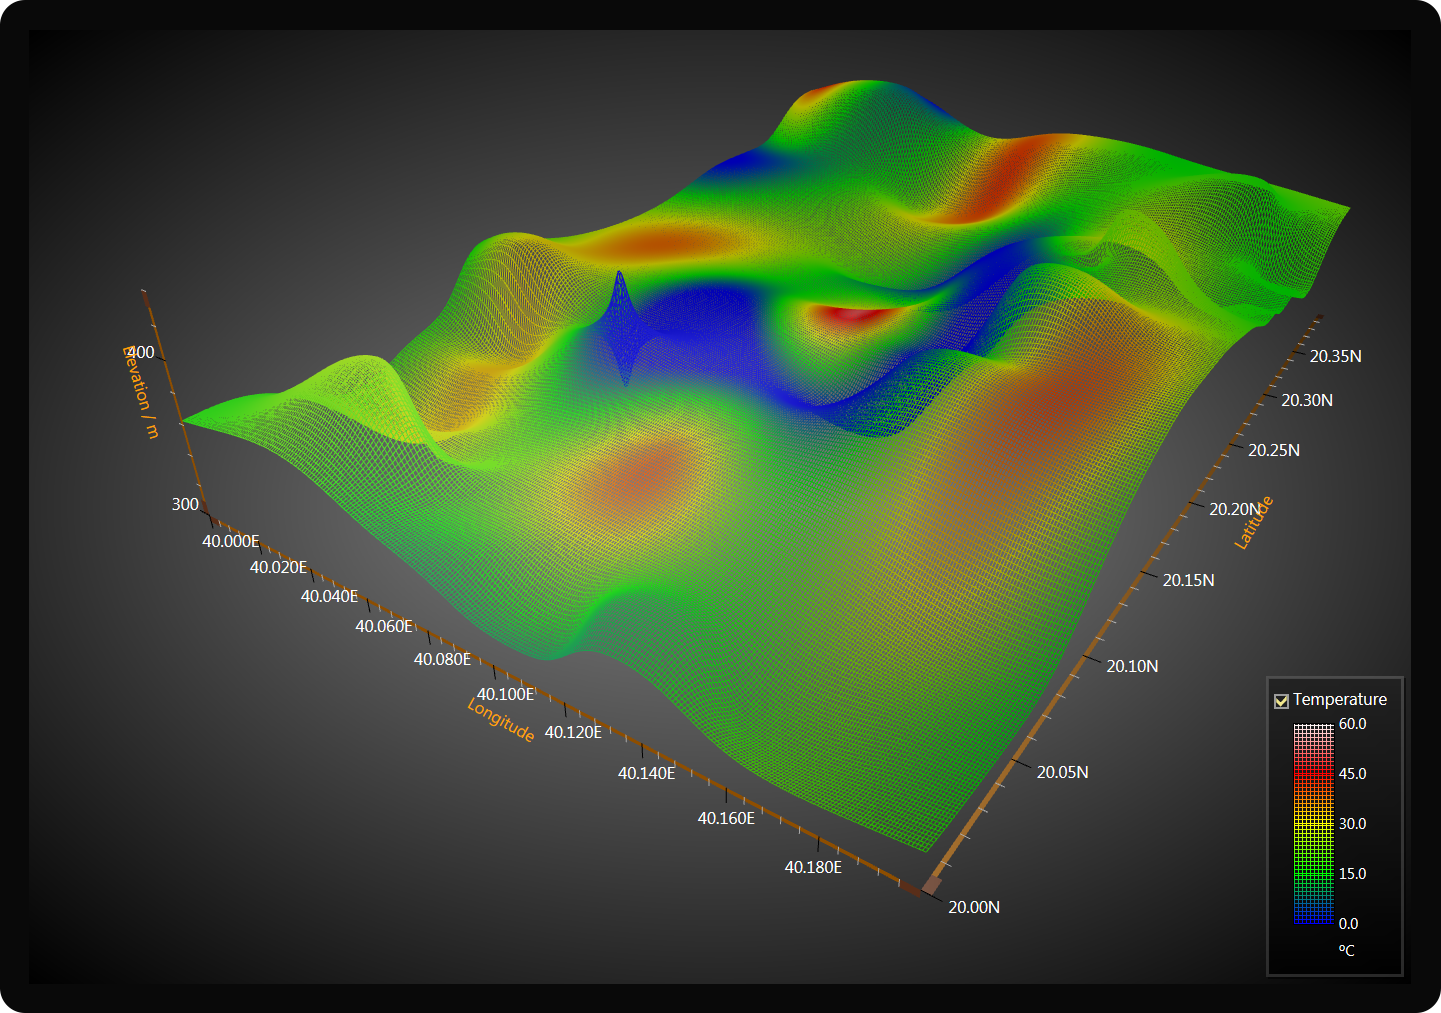
- Series types: Line series, Point series, PointLine series, PointCloud series, Box series, Surface series.
- Customize the shape of the Bounding Box of the 3D Chart.
- Linear Axes for X, Y and Z planes around Bounding Box of the 3D Chart.
- Use Numeric and DateTime format with Axis ticks.
- Camera can be controlled to rotate around and zoom in / out of the Chart area.
- 3D box series
- Customizable with value based coloring, solid coloring for all boxes, individual box colors, and the roundness of the Box Shape edges.
- Supports dynamic coloring by x, y or z coordinates.
- 3D surface series
- Customizable with: value based coloring, solid coloring, Data-Point based coloring.
- Comes with customizable wireframe.
Heatmaps
- Usable in XY Charts.
- Create a 2D rectangular heatmap using the IntensityGrid option.
- Create a 2D mesh Heatmap using the IntensityMesh option.
- Use Heatmaps to create Spectrograms.
Data Grid
Grid control that can be used as a standalone application or within a dashboard.
- Unlimited rows and columns.
- Supports text, numbers, images, icons, spark charts, etc.
- Supports cell merging, dynamic coloring, full customization.
Polar Charts
- Series Types (all stylable with familiar API): Line series, Point series, PointLine series, Polygon series and Area series.
- Polar Sectors (easily stylable with familiar API). Highlight a section of the Polar Chart with ease.
- Can be rotated via API.
- AutoCursor is available for Polar Charts.
- Can be used as a stand-alone Chart, or in a Dashboard.
Pie / Donut charts
- Slices can be styled using different fill and border-styles.
- Fully customizable sorting and formatting of Slices.
- Slice value transitions as well as disposing/restoring are animated.
- Two designs:
- Labels on side with connector-lines
- Labels inside Slices
- Slices can be “exploded” programmatically or by mouse/touch.
Funnel Charts
- Slices can be styled using different fill and stroke styles.
- Slices can have empty gaps in between.
- Fully customizable sorting and formatting of slices.
- Labels can be set on side with connector lines or inside slices.
- Two different ways to show the slices based on their values: Variable width and Variable height.
- Slices can be animated. Changing values of slices, adding and removing slices support animations.
- User can enable or disable animations for all slices.
Gauge Charts
- Gauge can be styled using different fill and stroke styles.
- Set the thickness of the Gauge.
- Gauge Slice can be styled using different fill styles.
- Fully customizable formatting and styling of slices.
- Customize the start and end angles of the gauge.
- Customize the value interval of the gauge.
- Gauge value change, interval and angle transitions and gauge dispose/restore are animated.
Pyramid Charts
- Slices can be styled using different fill and stroke styles.
- Slices can have empty gaps in between.
- Fully customizable sorting and formatting of slices.
- Labels can be set on side with connector lines or inside slices.
- Slices can be animated. Changing values of slices, adding and removing slices support animations.
- User can enable or disable animations for all slices.
Radar / Spider charts
- Categorical automatically generated axes.
- Round and lines grid.
- Line, point and filled area series.
- Scaling modes include fitting, expansion and manual.
- Data cursors have customizable shape and styles.
Map Charts
- Can be used as a stand-alone Chart component or placed inside a Dashboard.
- Supports following views: World, USA, North America, South America, Canada, Europe, Asia, Africa and Australia.
- Supports Auto Cursor feature for displaying region data with mouse.
- Can be colored with solid color for entire map, or with dynamic color per region.
- Supports LUT UI element for visualizing dynamic color table.
- Supports real-time updates.
LightningChart JS
| License type | Publisher | SaaS | Application Developer | Application Developer for Internal Intranet Deployment | Enterprise |
| 2D charts | V | V | V | V | V |
| 3D charts | V | V | V | V | V |
| Commercial use for web site (no login) | V | V | |||
| Intranet servers | V | V | |||
| SaaS (web site requiring login) | V | V | |||
| Installable / Salable Applications, Desktop / Mobile / Embedded | V | V | |||
| Commercial use | V | V | V | V | V |
| LightningChart Logo Removed | V | V | V | V | V |
| Examples source code | V | V | V | V | V |
| Libraries source code available for purchase at extra cost | V | ||||
| Technical support | V | V | V | V | V |
| Fintech support | Check LightningChart JS Trader | Check LightningChart JS Trader | Check LightningChart JS Trader | Check LightningChart JS Trader | Check LightningChart JS Trader |
| Deployment rights | Per domain, check deployment domains | Per domain | 1 named installable application | Only for own (internal) intranet depoyment | Contact us |
