SmartPLS 是偏最小平方法結構方程模型(PLS-SEM)的領先的軟體工具之一,
SmartPLS可以幫您在幾分鐘內輕鬆的應用PLS-SEM方法。SmartPLS是潛變量模型的里程碑,
其結合了現有技術方法(例如:PLS-POS、IPMA、complex bootstrapping routines),且配有易於使用的和直觀的圖形用戶界面。
PLS是結構方程模型的一種統計分析方法,這是一種探測或建構預測性模型的分析技術,尤其是對於潛在變項之間的因果模型(causal model)分析,優於一般的線性結構關係模式,且被引用到超過2500以上的學術刊物中使用,受到學者專家的肯定。
更新介紹
CB-SEM
You can run covariance-based structural equation modeling (CB-SEM) analyses (like in IBM® SPSS® Amos). Thereby, you can now create, estimate, and evaluate models using CB-SEM. You can also use this new feature to run a confirmatory factor analysis (CFA).
Redesigned GUI
You can expect a fundamentally renewed and optimized GUI. We have developed this over the last few years based on the latest technologies, so SmartPLS will have a long-term future.
Improved performance
Performance has improved significantly in many areas. Algorithms like bootstrapping or FIMIX are now much faster.
Improved data import
Data sets are often available in Excel or SPSS formats. SmartPLS can now read these directly, without prior conversion to a CSV file.
Generate new data files from your results
New datafiles can now be created from calculation results directly which is useful especiall for higher-order models. You can select which data should be included in your new file - e.g. the scores from a PLS-SEM calculation. Immediately after that you can use the file for new calculations.
Side by side comparison
You can now compare reports more easily by simply opening them in our Compare View page.
Save your reports
Finally, SmartPLS reports can now be saved and opened again later. Exporting to Excel or to a website is of course still possible as well.
Customize charts
Diagrams can now be customized. For example, new colors or sizes for dots can be defined - but also many other properties can be changed and can also be saved as new defaults.
Many new methods
SmartPLS 4 now also supports new algorithms, model types and result representations. These include:
- Endogeneity assessment usign the Gaussian copula approach.
- Necessary condition analysis (NCA) including significance testing
- Regression models
- Path analysis and PROCESS, including bootstrapping of conditional direct and indirect effects
- Multiple moderation (e.g., three-way interactions)
- Accounting for scale type of variables in most algorithms
- Standardized, unstandardized and mean-centered PLS-SEM analysis
SmartPLS lets you do:
- Partial least squares (PLS) path modeling
- Ordinary least squares (OLS) regression based on sumscores
- Consistent PLS (PLSc)
- Weighted PLS (WPLS), weighted OLS (WOLS) and weighted consistent PLS (WPLSc)
- Bootstrapping and the use of advanced bootstrapping options
- Blindfolding
- Importance-performance map analysis (IPMA)
- PLS multi-group analysis (MGA): Analyses the difference and significance of group-specific PLS path model estimations
- Higher-order Models
- Mediation: Estimation of indirect effects and their bootstrap-based significance testing
- Moderation: Estimation of interaction effects and their bootstrap-based significance testing
- Nonlinear relationships: Estimation of quadratic effects and their bootstrap-based significance testing
- Confirmatory tetrad analysis (CTA): A statistical technique which allows for empirical testing the measurement model setup
- Finite mixture (FIMIX) segmentation: A latent class approach which allows identifying and treating unobserved heterogeneity in path models
- Prediction-oriented segmentation (POS): An approach to identify groups of data
- PLS Predict: A technique to determine the predictive quality of the PLS path model
- Prediction-oriented model selection
Lift the Treasure of Your Data
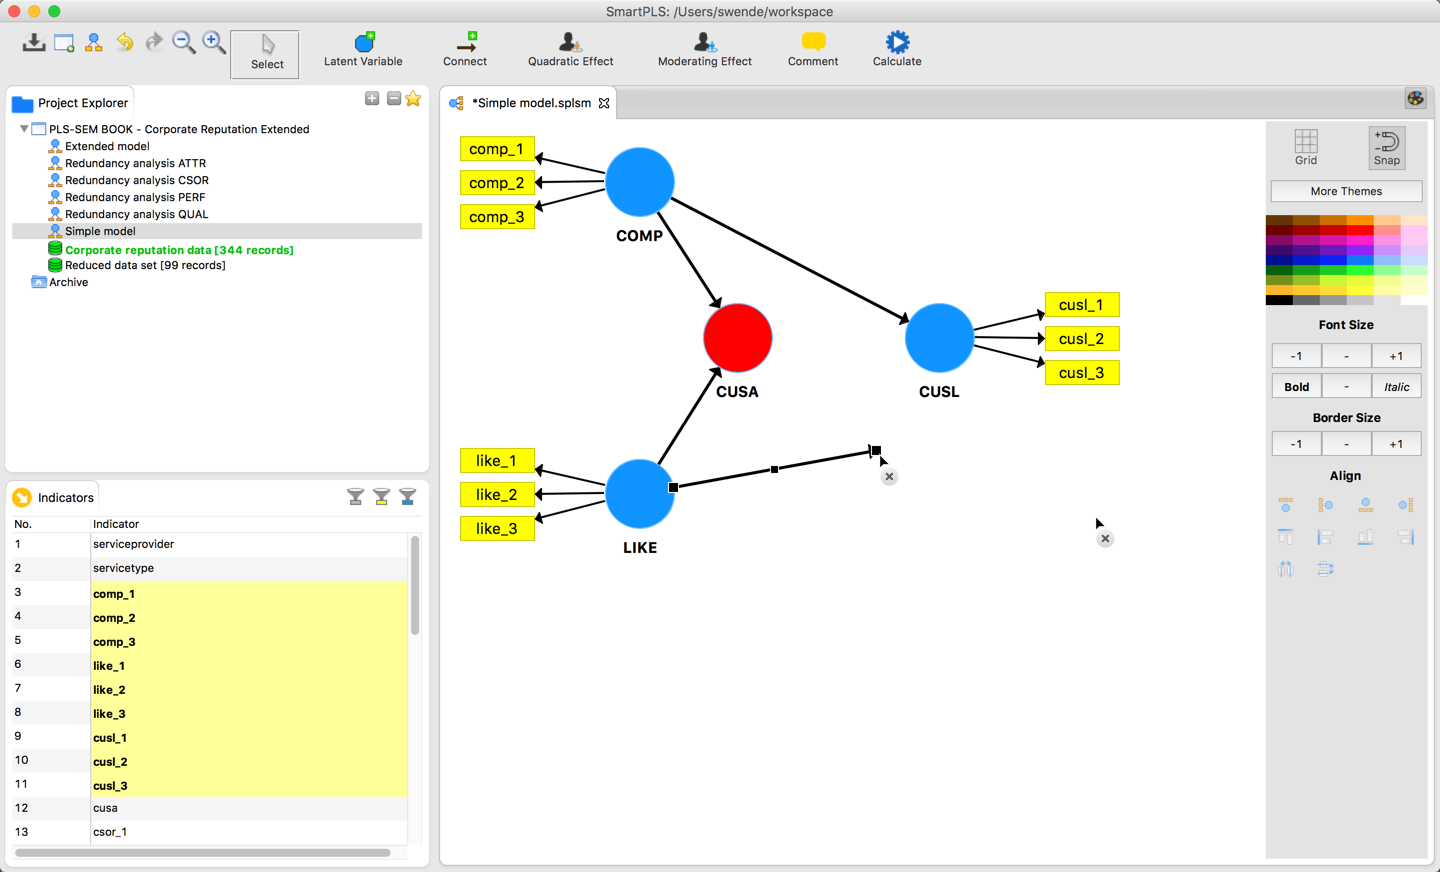
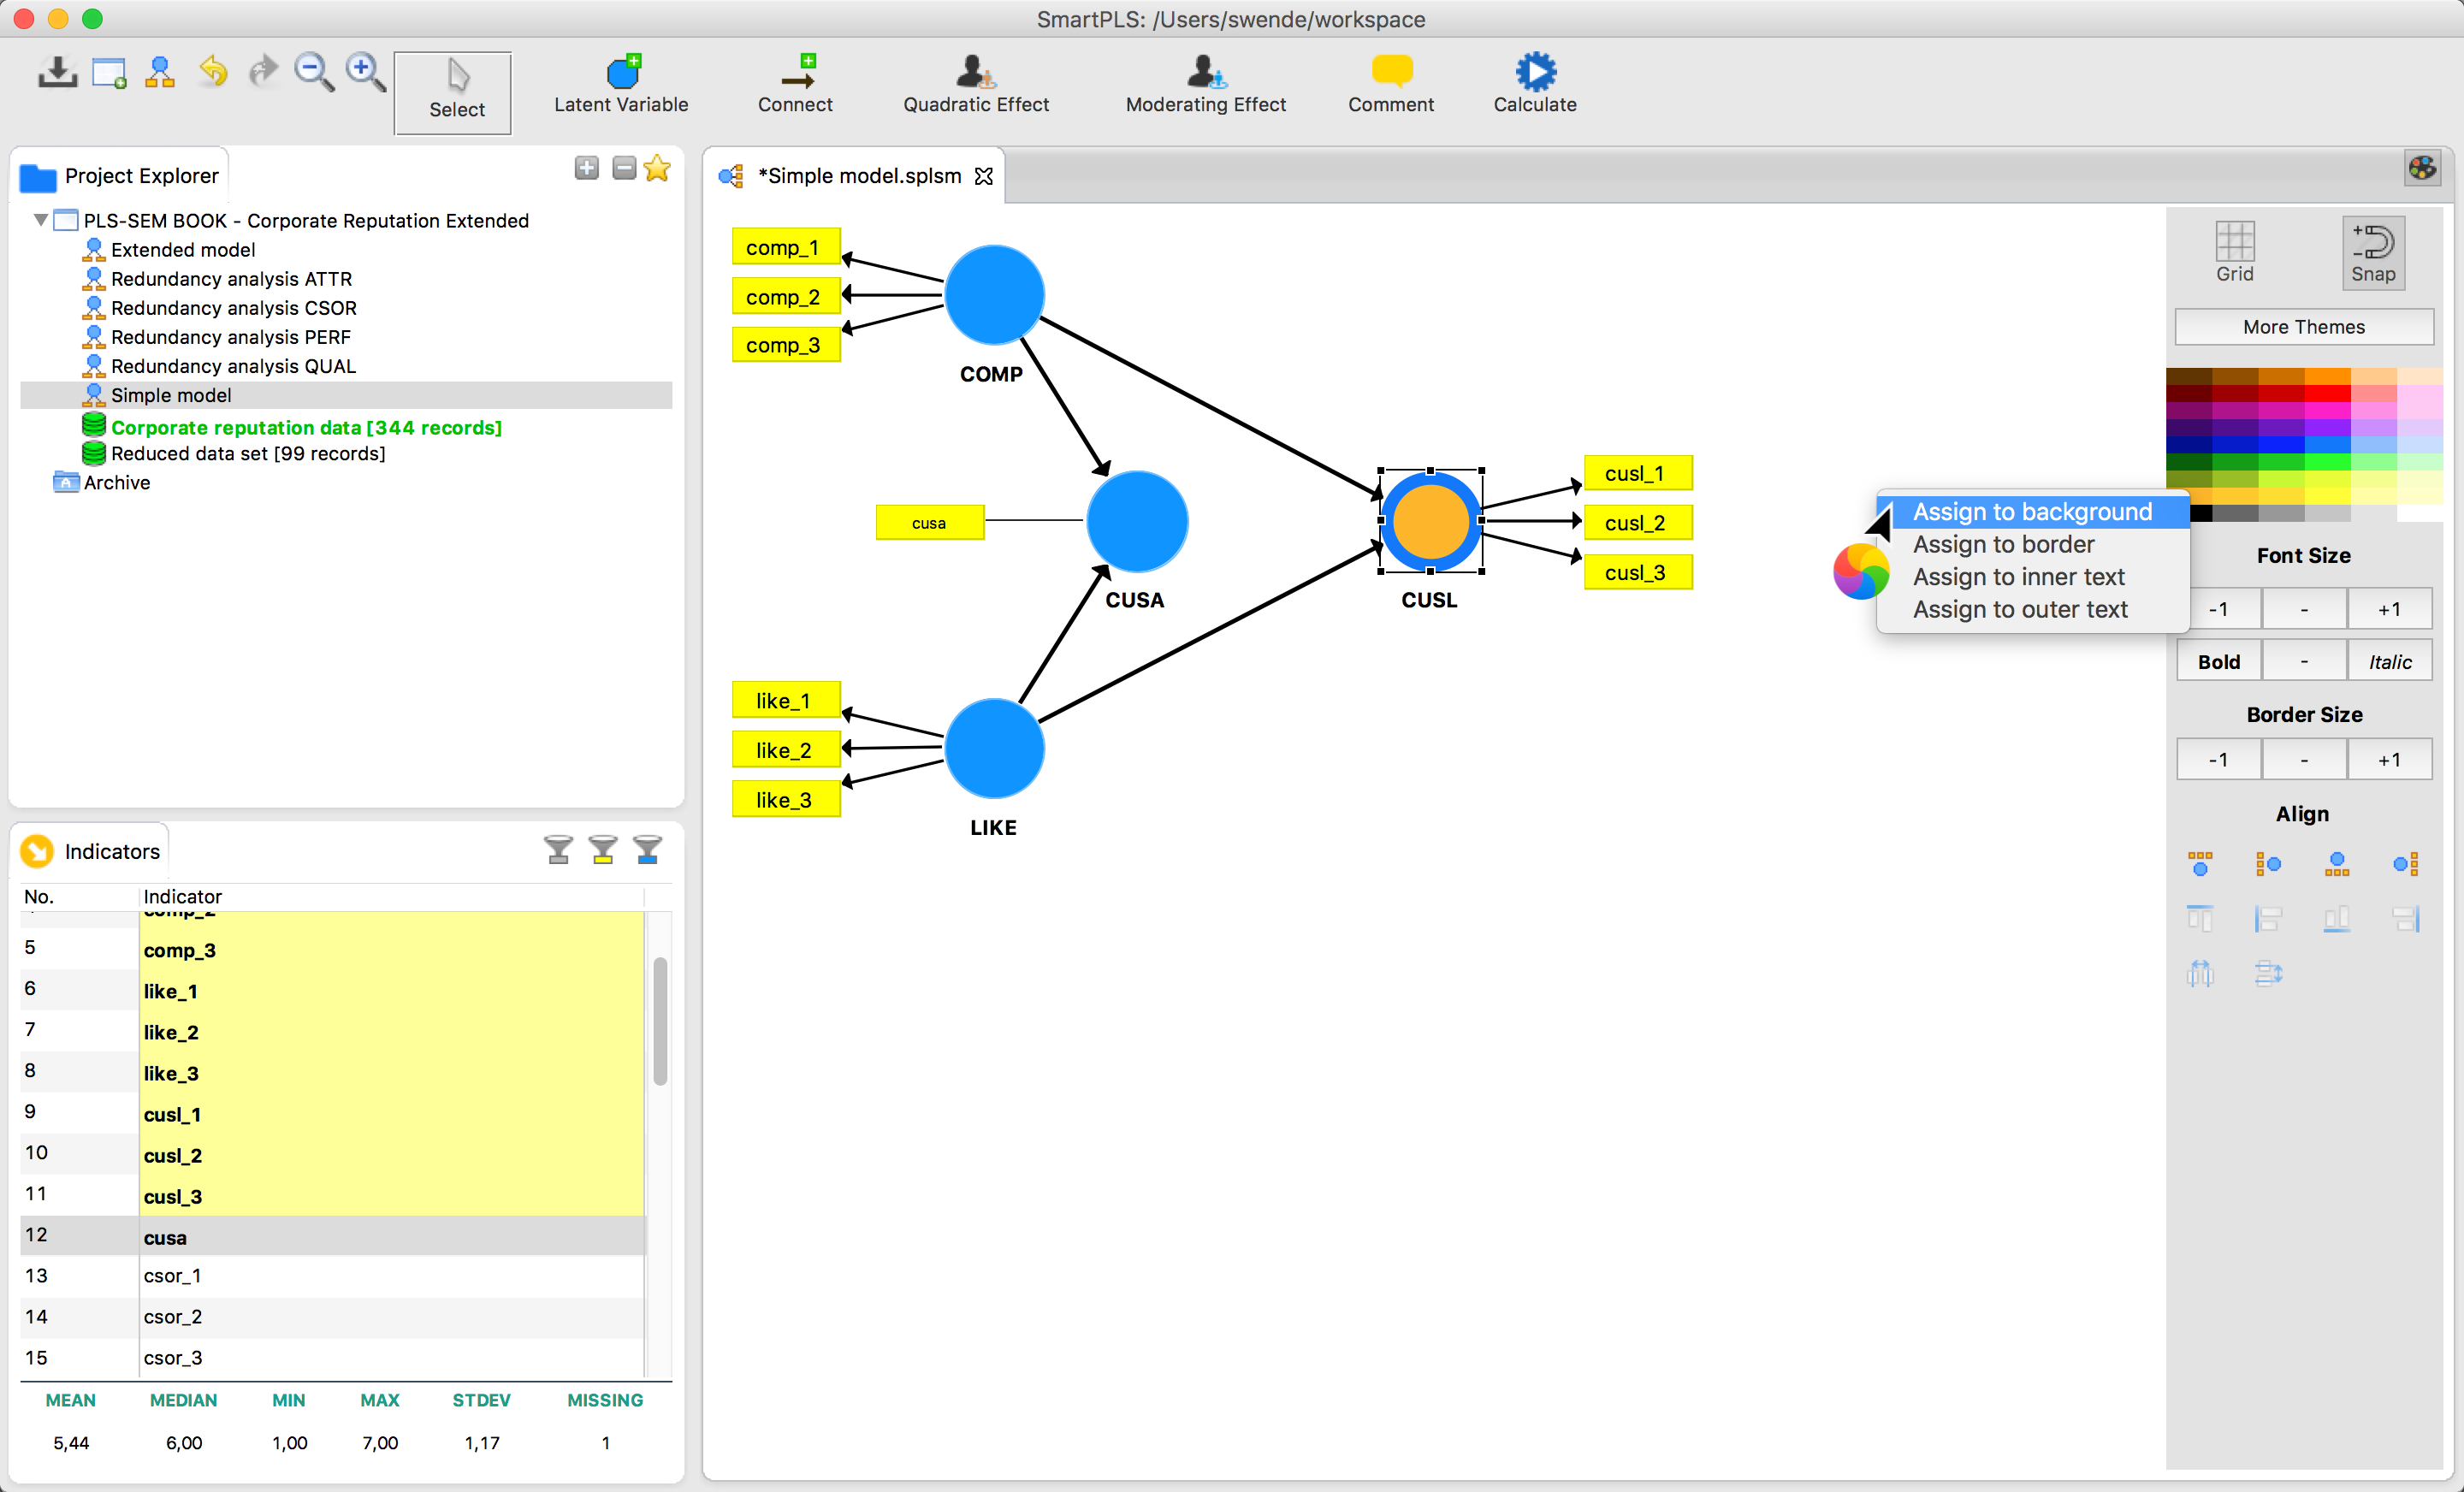
The intuitive graphical user interface lets your create pretty path models with SmartPLS in minutes.
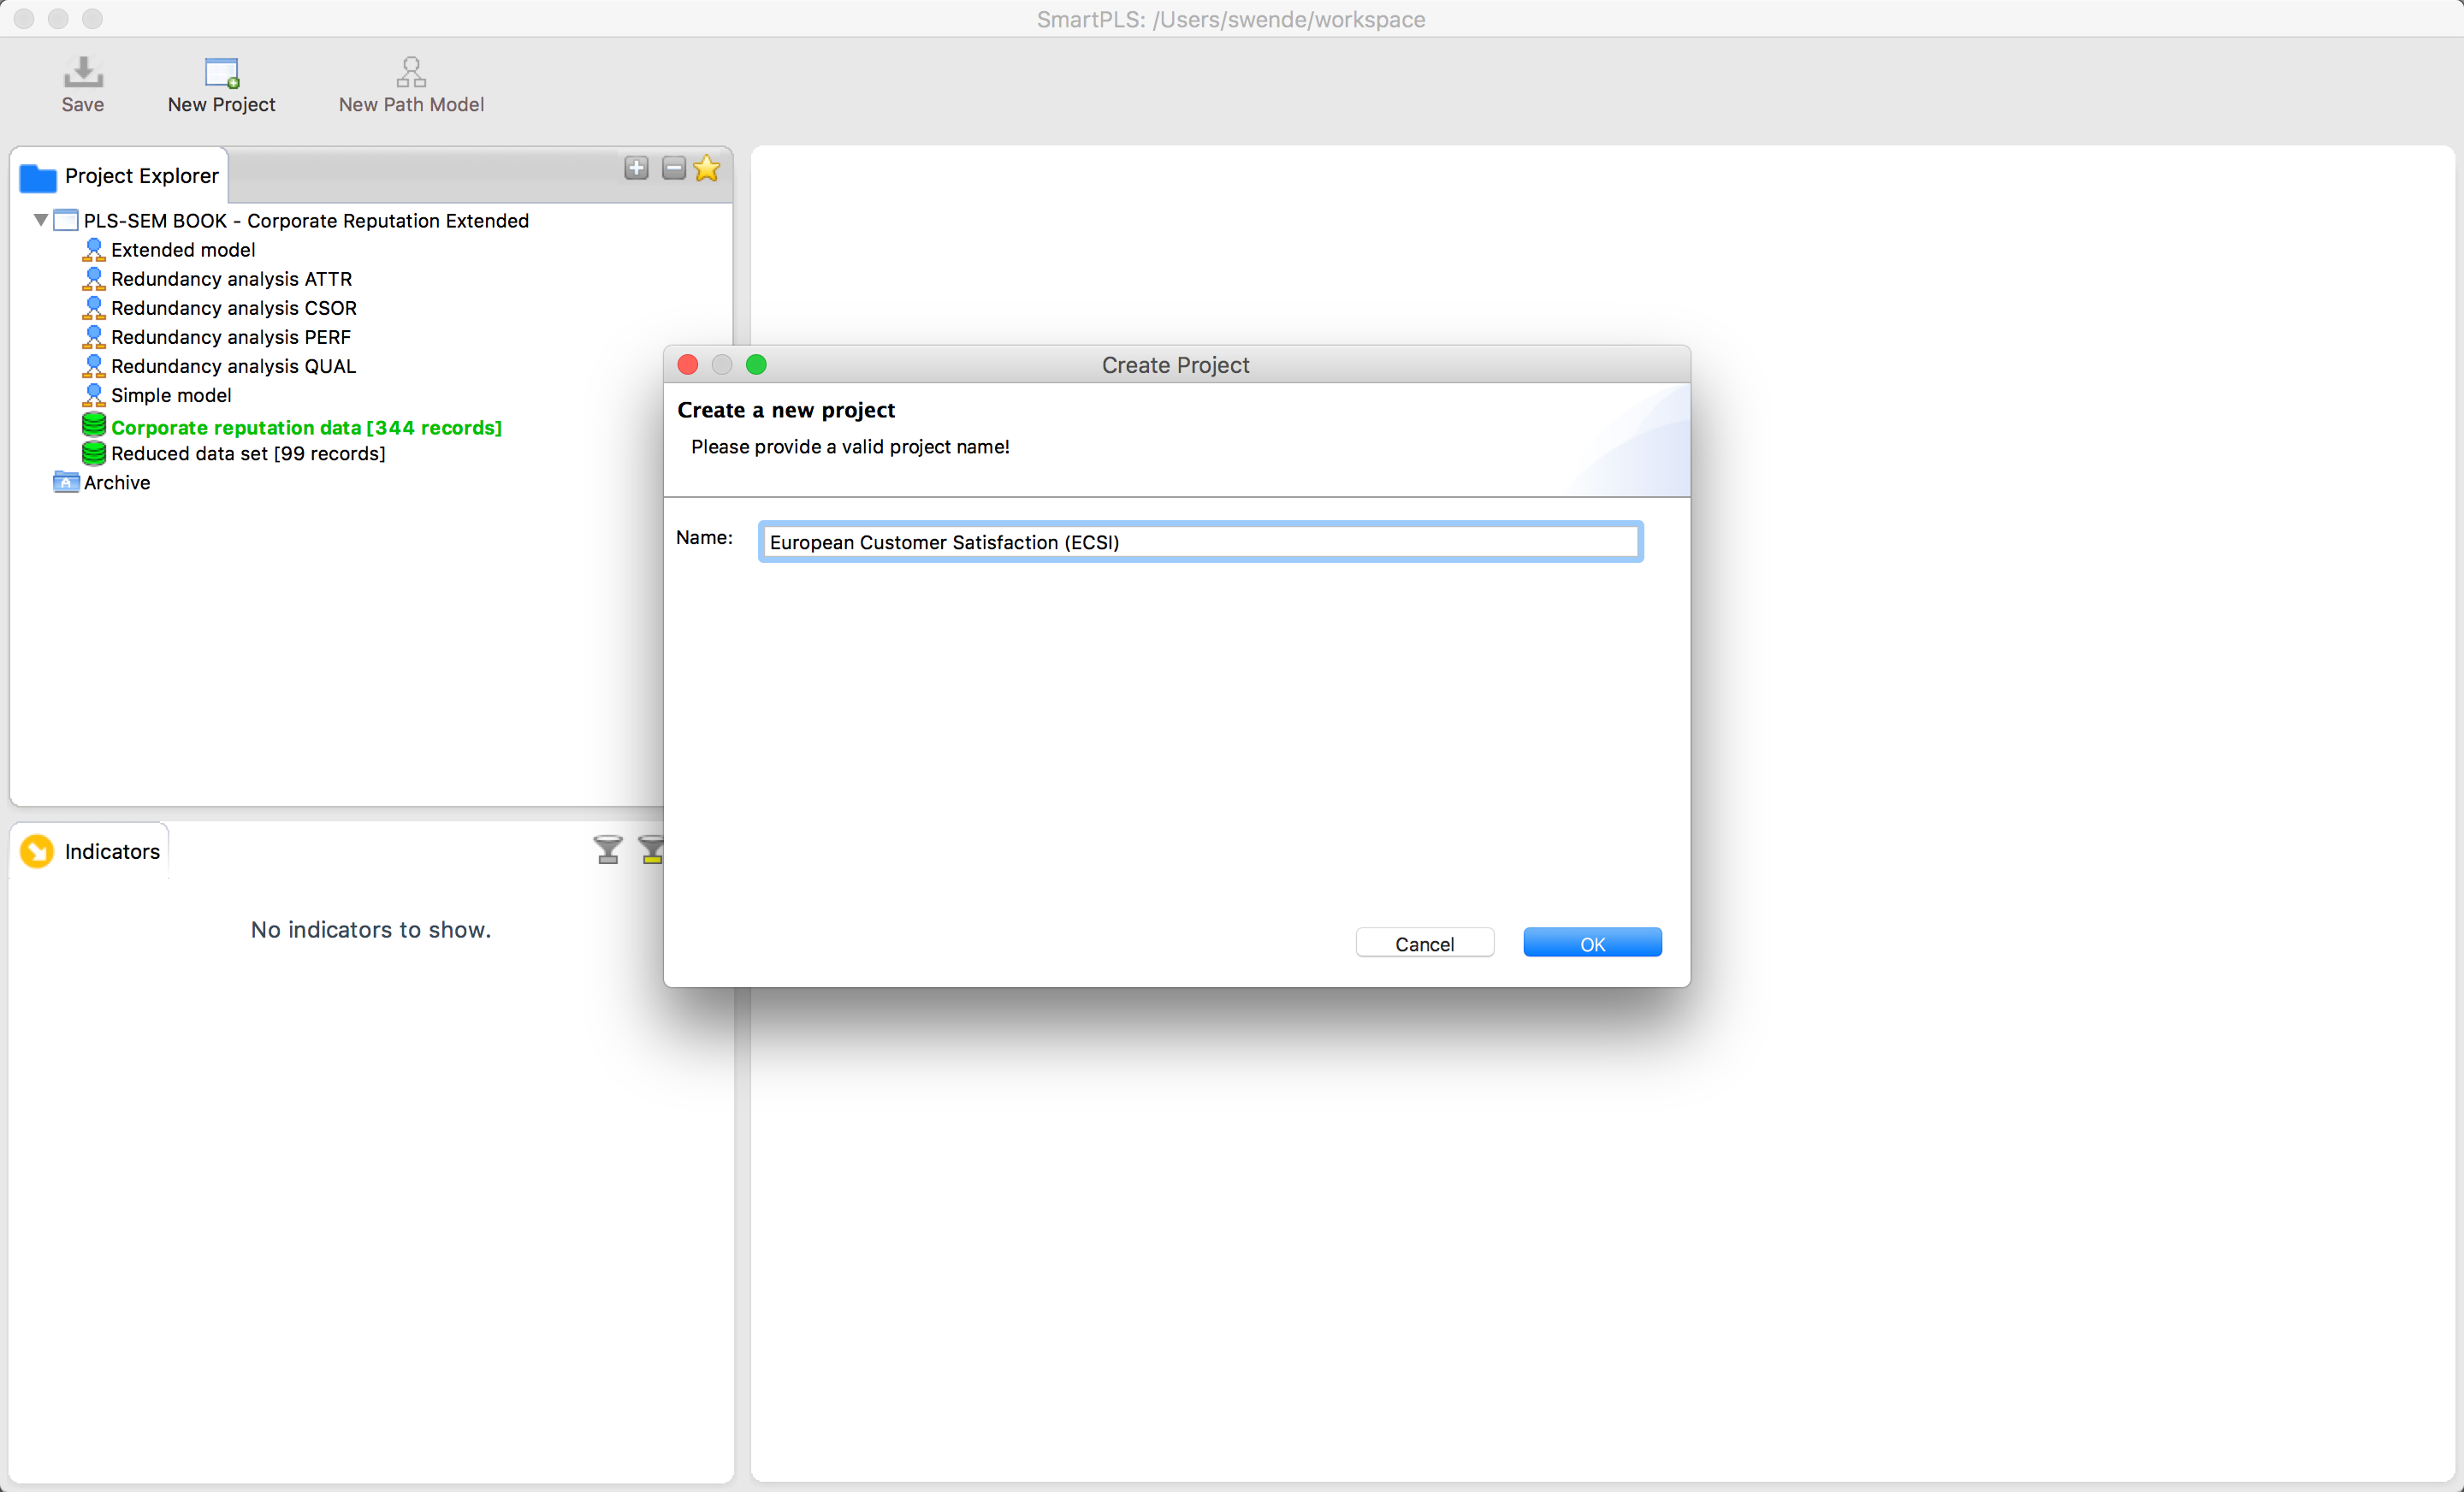
Do you want to stay on top of your files? Our Project Explorer helps you organizing your data and models efficiently in separate projects. You can easily export, import and archive your projects when using SmartPLS.
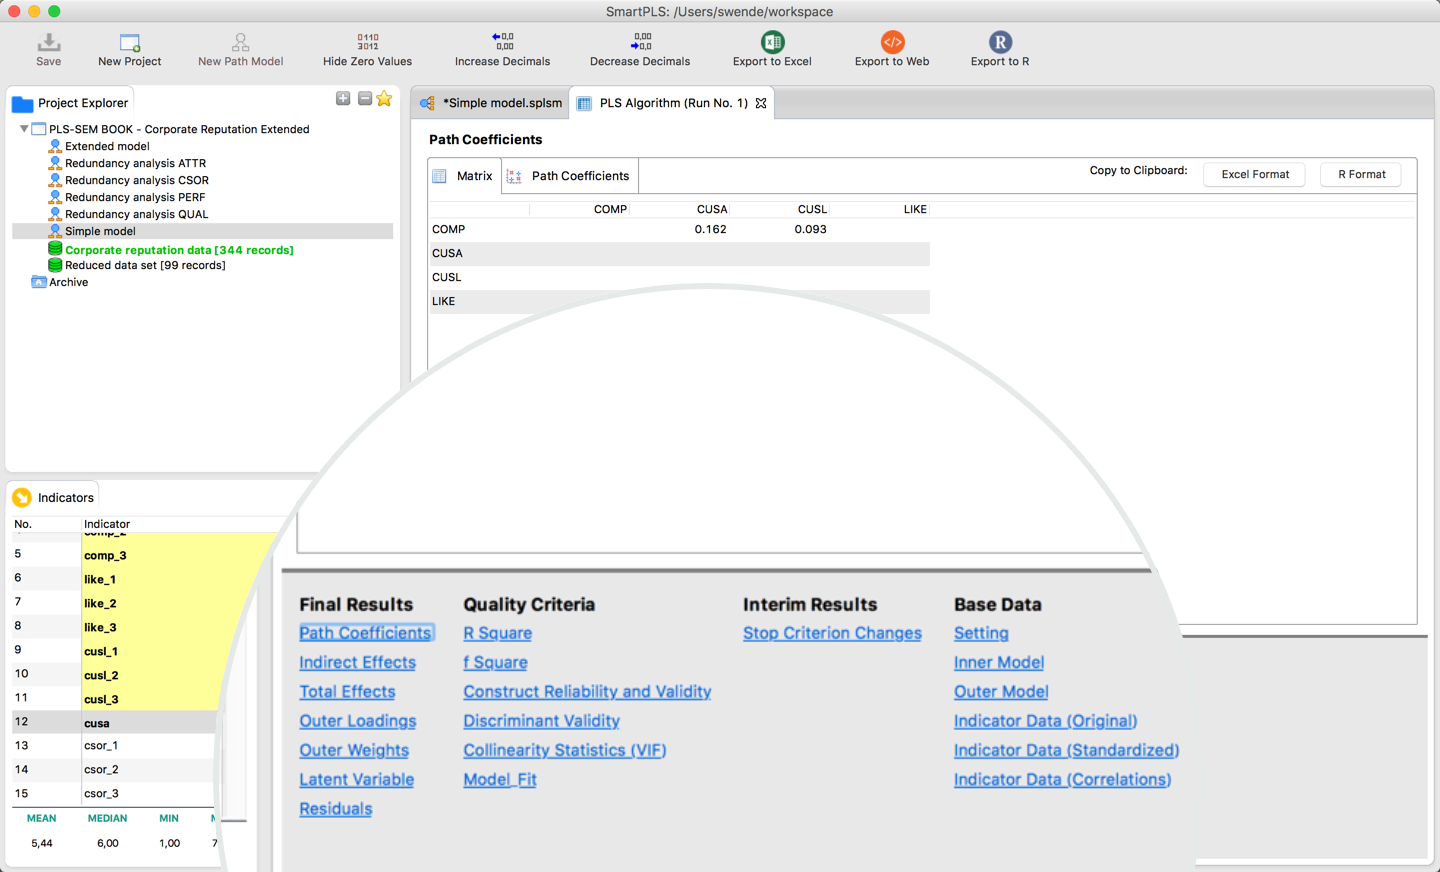
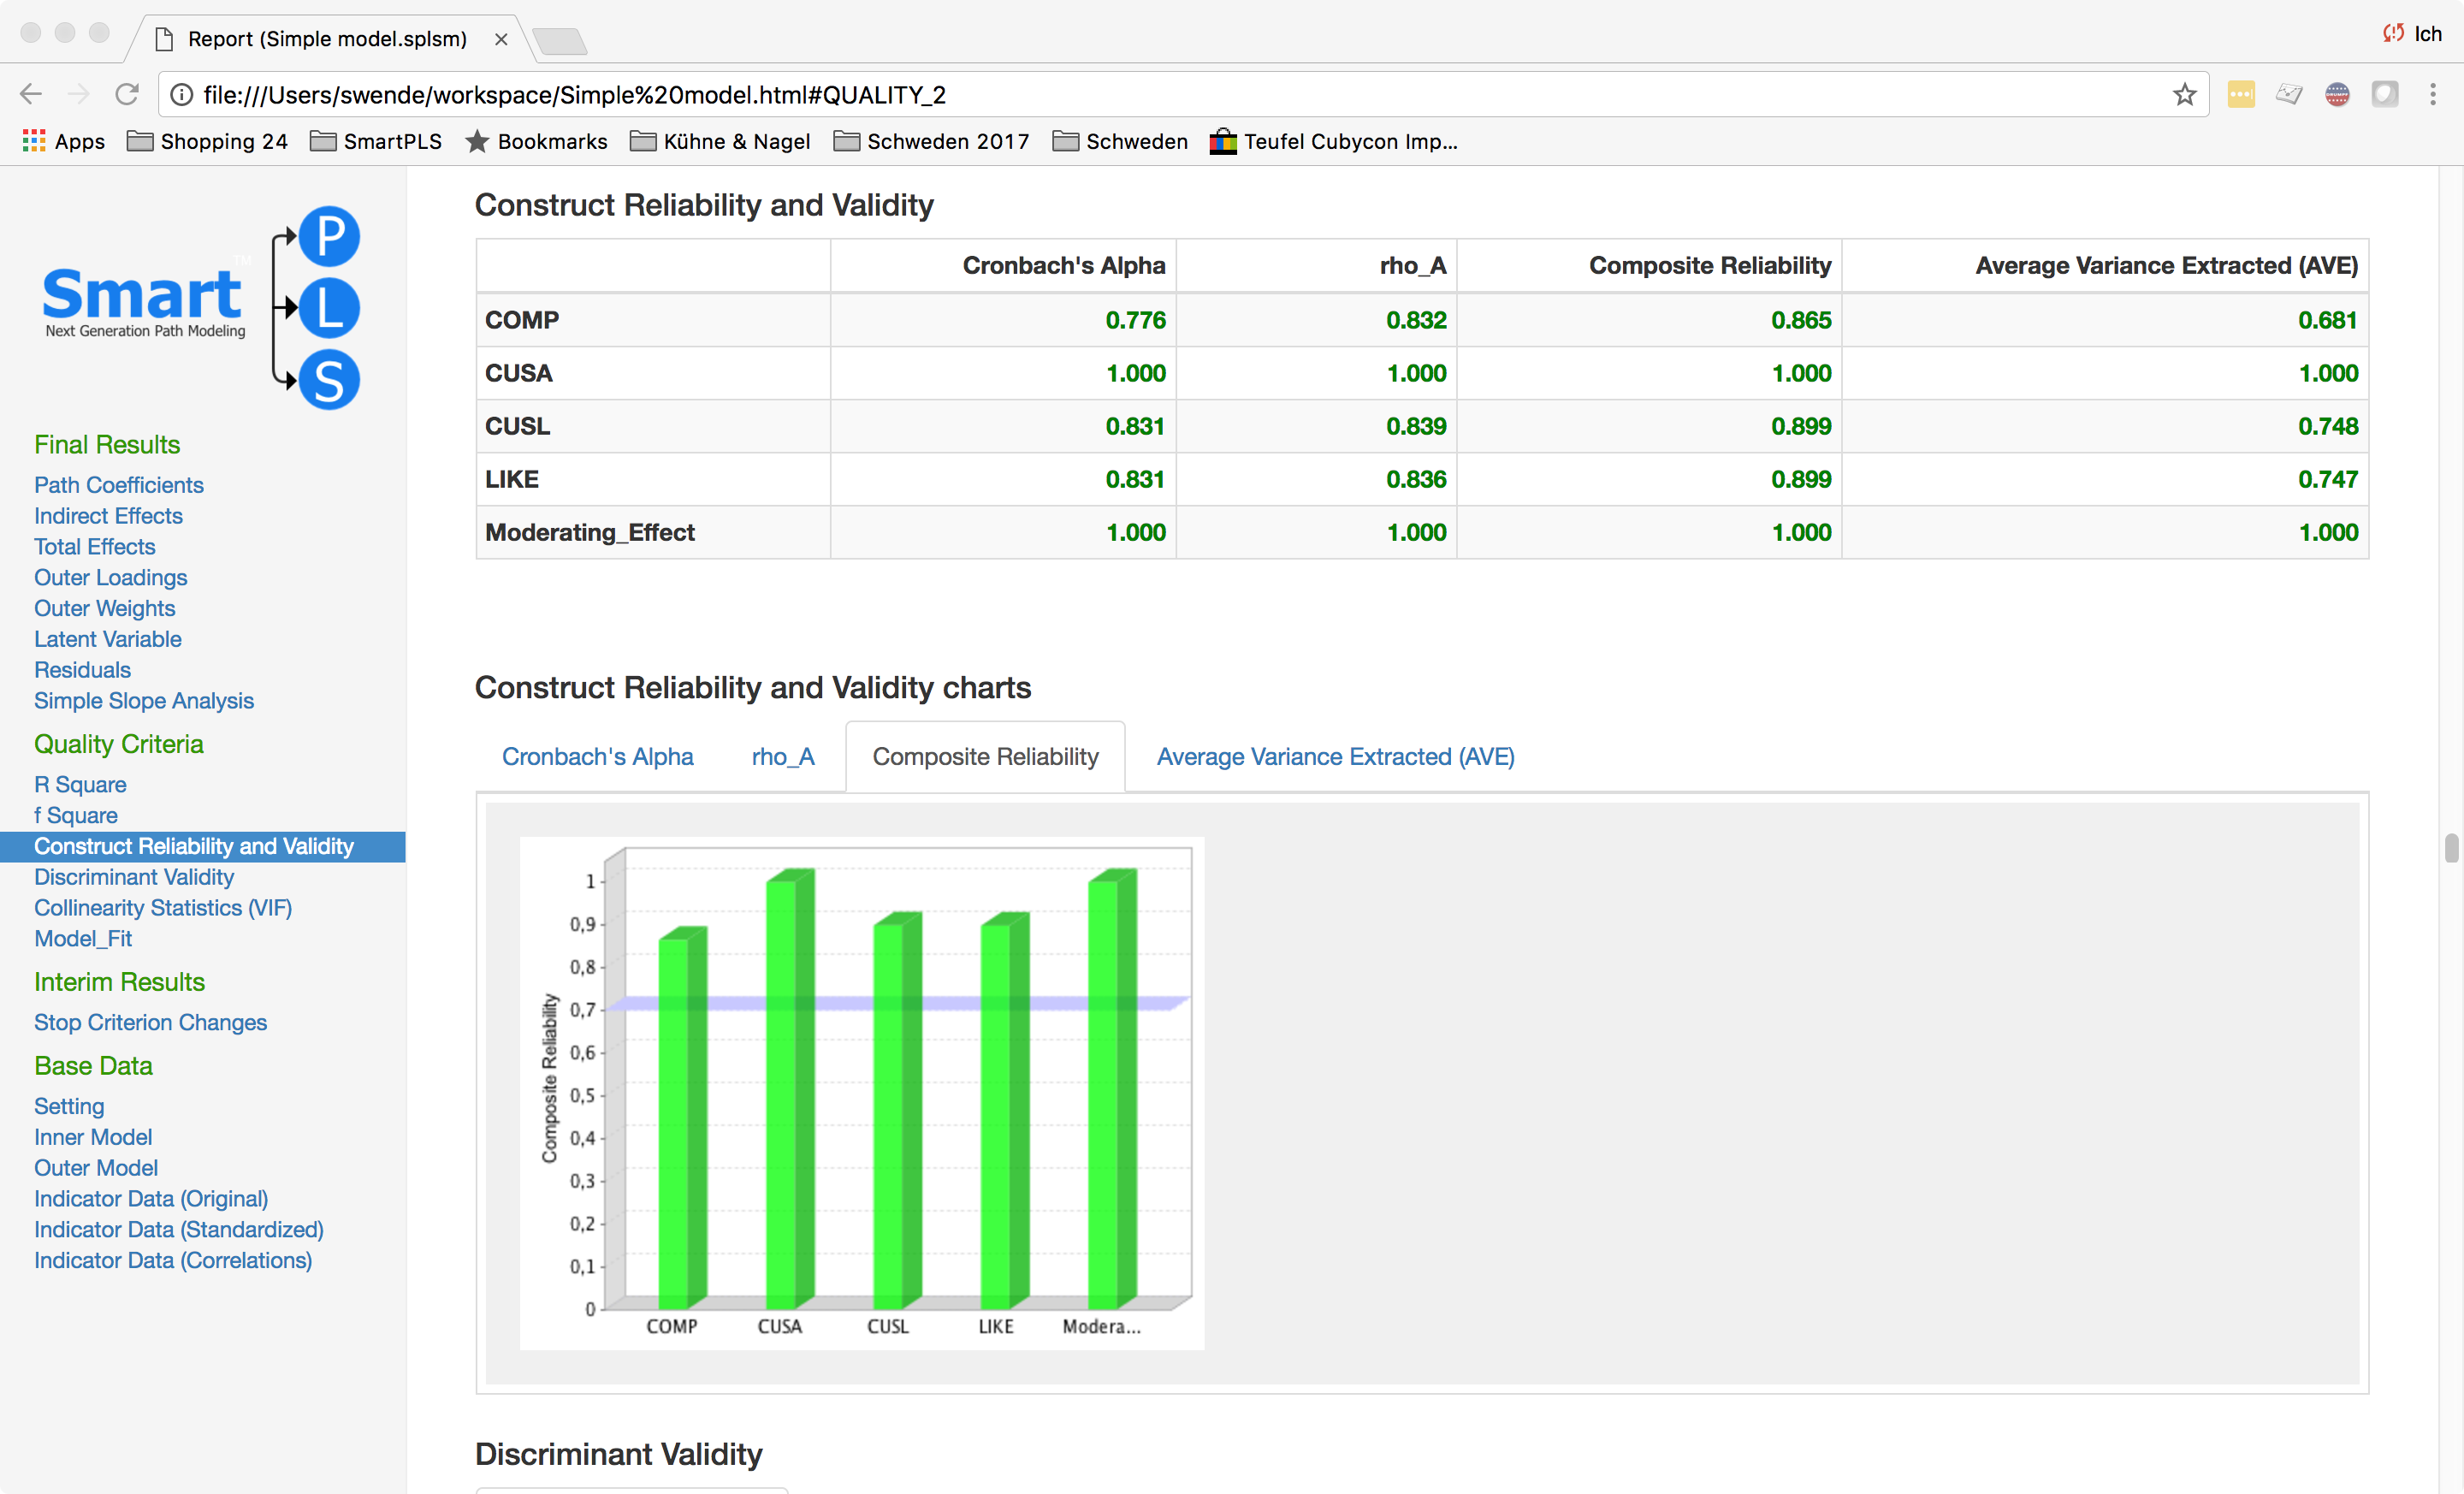
You find all information that you need to assess the outcomes and to competently write-up your paper in the SmartPLS results reports. They are well-organized and provide a good orientation. You can export all results to Excel, HTML or R.
Get on board easily
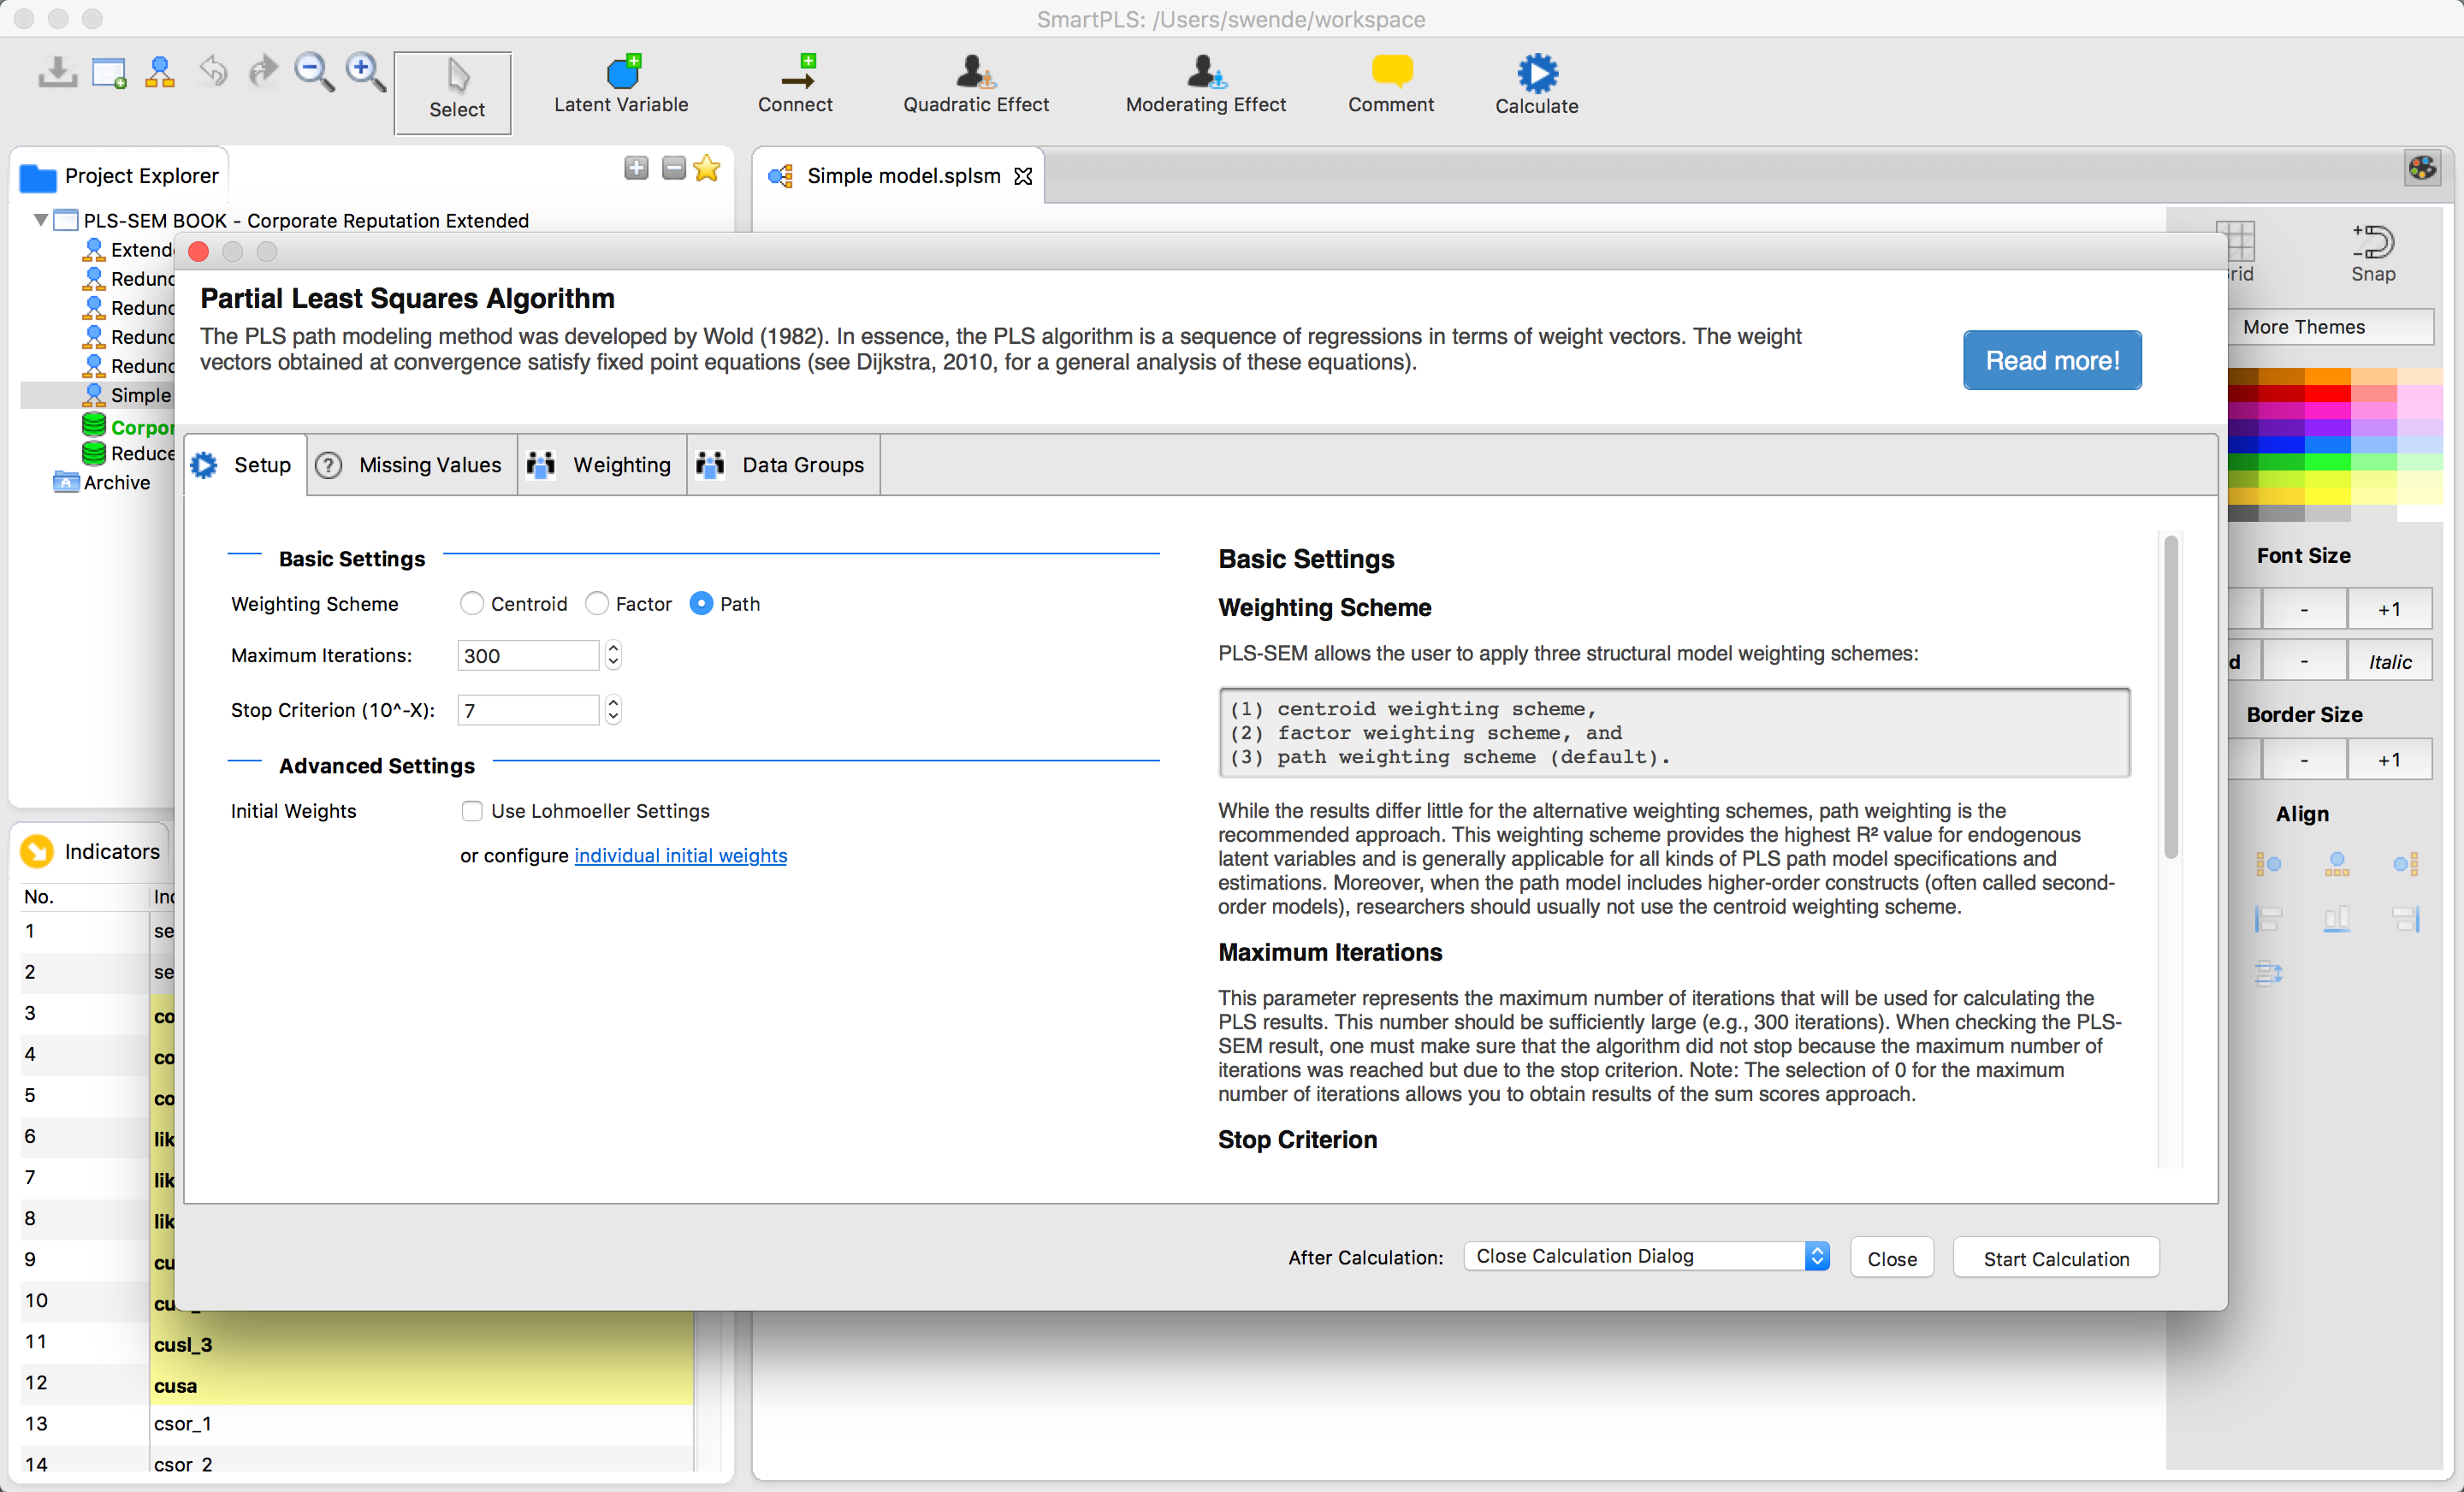
SmartPLS offers a rich portfolio of analyses and reports. But don´t worry! Each algorithm is explained by our built-in documentation. Our default algorithm settings represent the best choice for most computations. Start right away, save a lot of time and focus on the results of your analysis!
| Student | Professional | |
| Commercial Use Allowed | V | |
| Standard algorithms PLS-SEM, Bootstrapping, Regression |
V | V |
| Extended algorithms CTA, IPMA, PLSpredict, FIMIX, POS, Bootstrapping MGA, Permutation MGA, Path analysis and PROCESS, NCA |
V | |
| Import data files A maximum dataset might apply. |
CSV Limited to 100 records |
CSV, Excel, SPSS Unlimited size |
| Save reports Internal format |
V | |
| Compare reports Side-by-side |
V | V |
| Export reports To Excel or as HTML website |
V | |
| Generate new datasets from results Useful especially for higher-order models. |
V | |
| Customize models Change colors, borders, fonts, shapes, arrows etc. |
V | |
| Customize and export charts Change colors, dots etc. |
V | |
| Email Support Response Time Usually via email. If necessary via AnyDesk. |
Within 5 days | Within 48 hours |
SmartPLS 4 for Microsoft Windows
SmartPLS is compatible with 64-bit Windows 7-11, Windows Server 2012-2023.
SmartPLS 4 for Mac OSX.
Compatible with Mac OSX from Big Sur (11.x) to Sonoma (14.x).
SmartPLS 4 for Linux.
Experimental. Tested on 64-bit Ubuntu 22.04.3. Might work on other Linux desktops as well.
System requirements
These are the minimum requirements for your computer:
- approx. 200 MB free hard disk space
- at least 2GB RAM
Supported operating systems
The latest version of SmartPLS 4 is supported on these operating systems.
- 64bit Windows
- 64bit MacOSX from Big Sur (11.x) to Sonoma (14.x)
- 64bit Linux Ubuntu
Note: For a limited time, until the end of 2024, we offer SmartPLS 4.0.9.6 as a fallback version specifically designed for users with older Mac OSX systems (<11.x). Please be aware that this version cannot be updated to the latest SmartPLS 4 version due to incompatibilities.
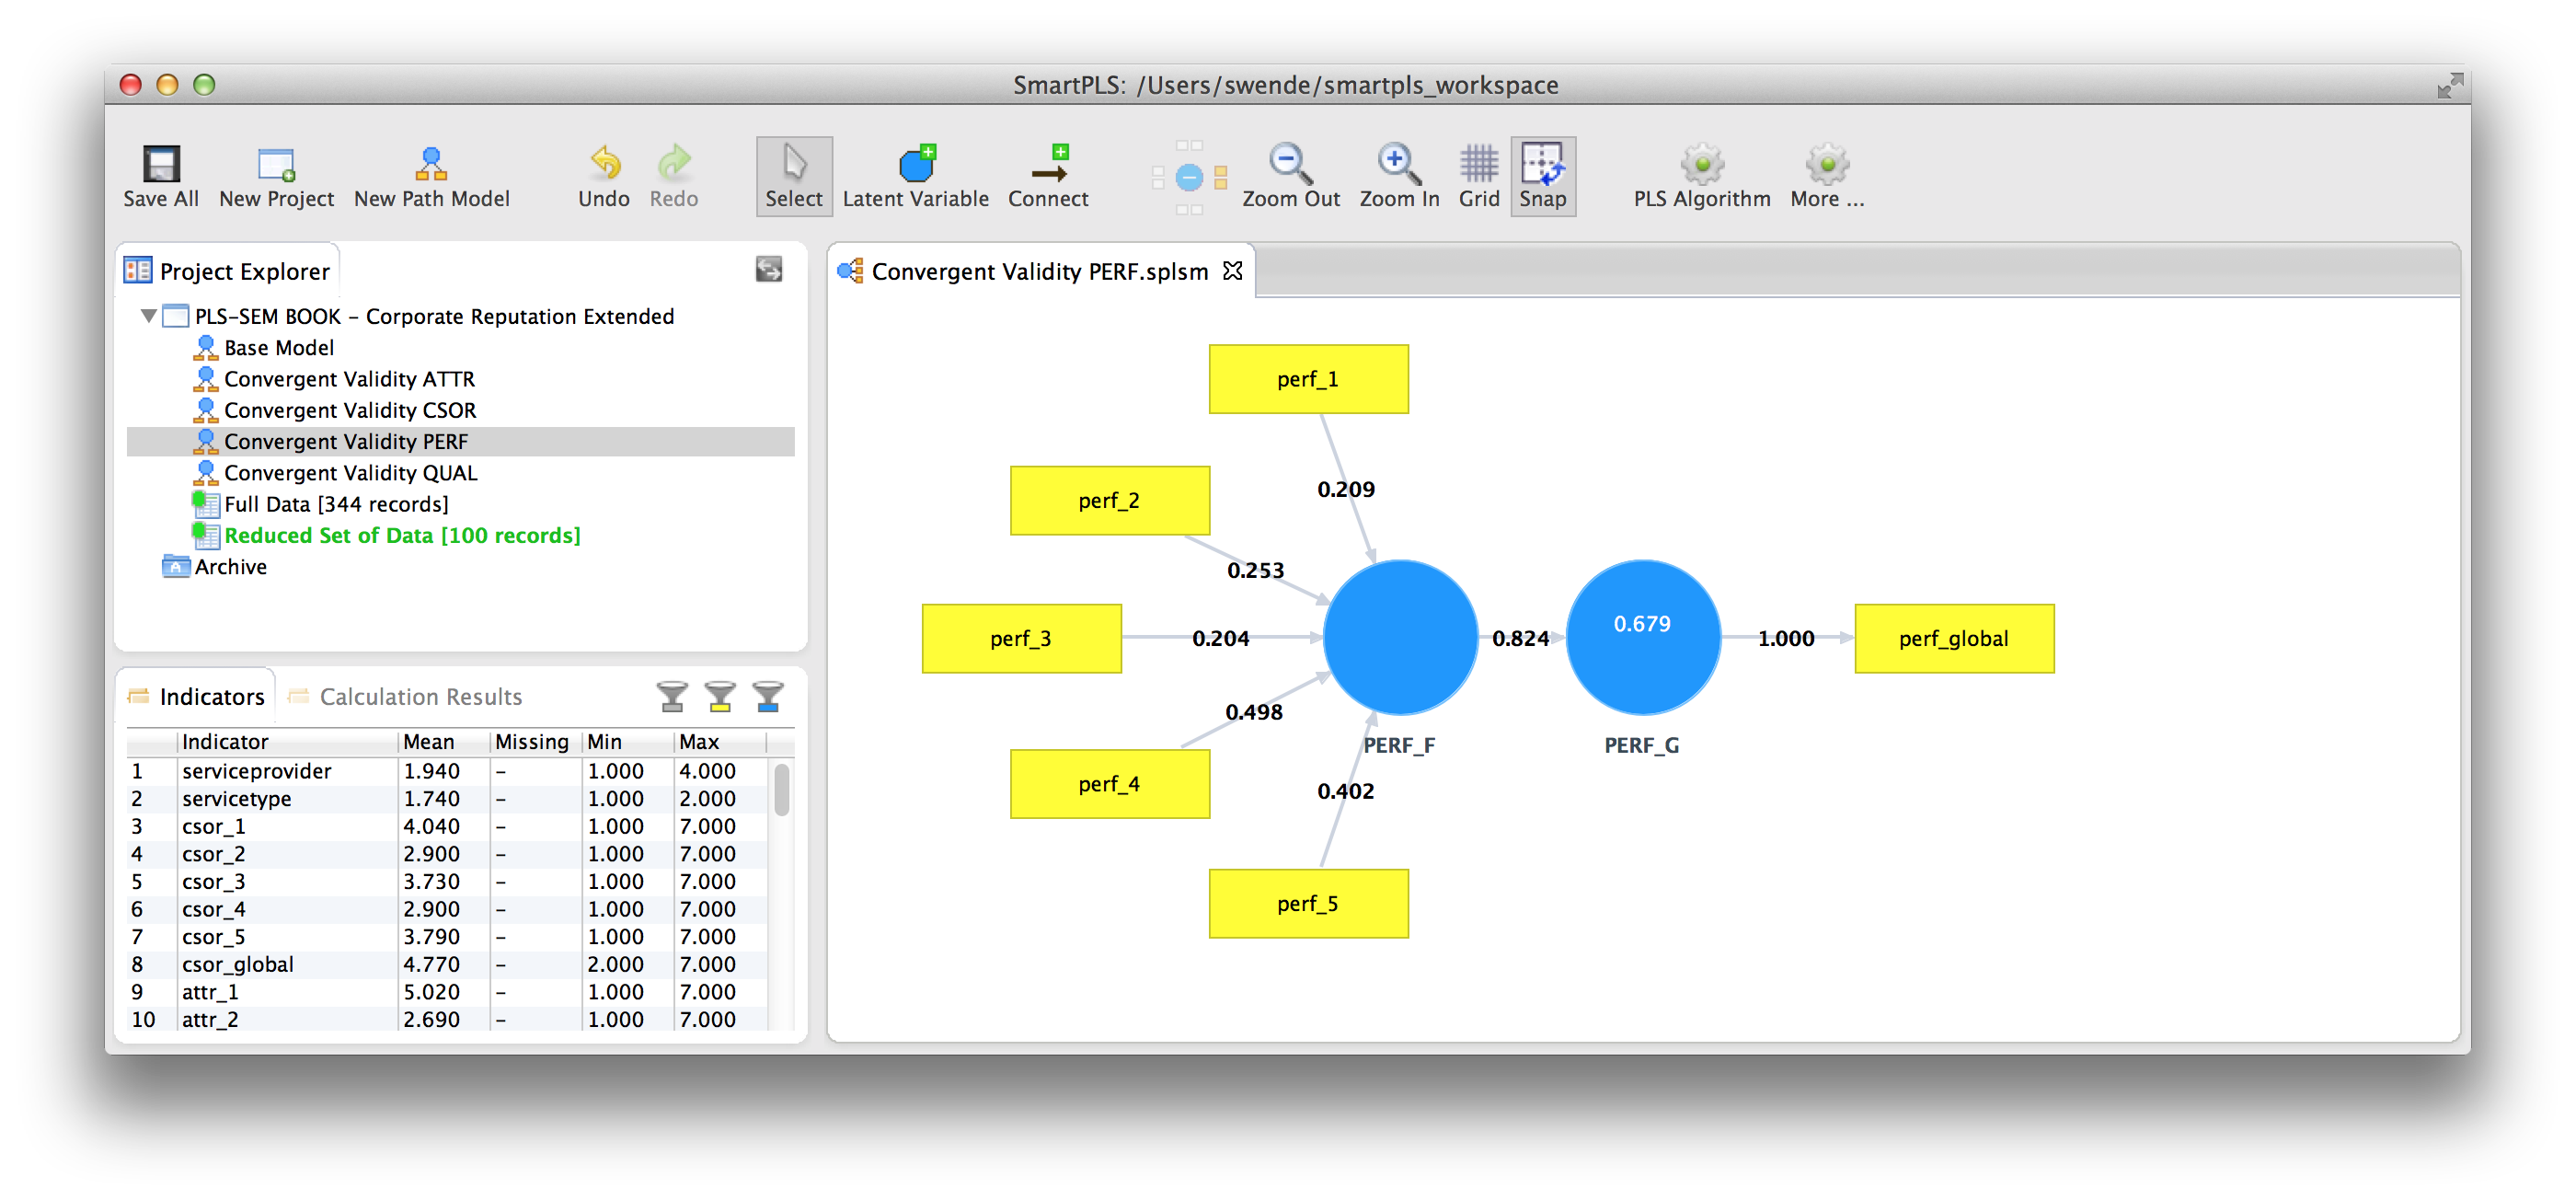
The powerful modeling environment lets you create a path model in minutes.
The project manager helps you to keep track of all your analyzes and files.
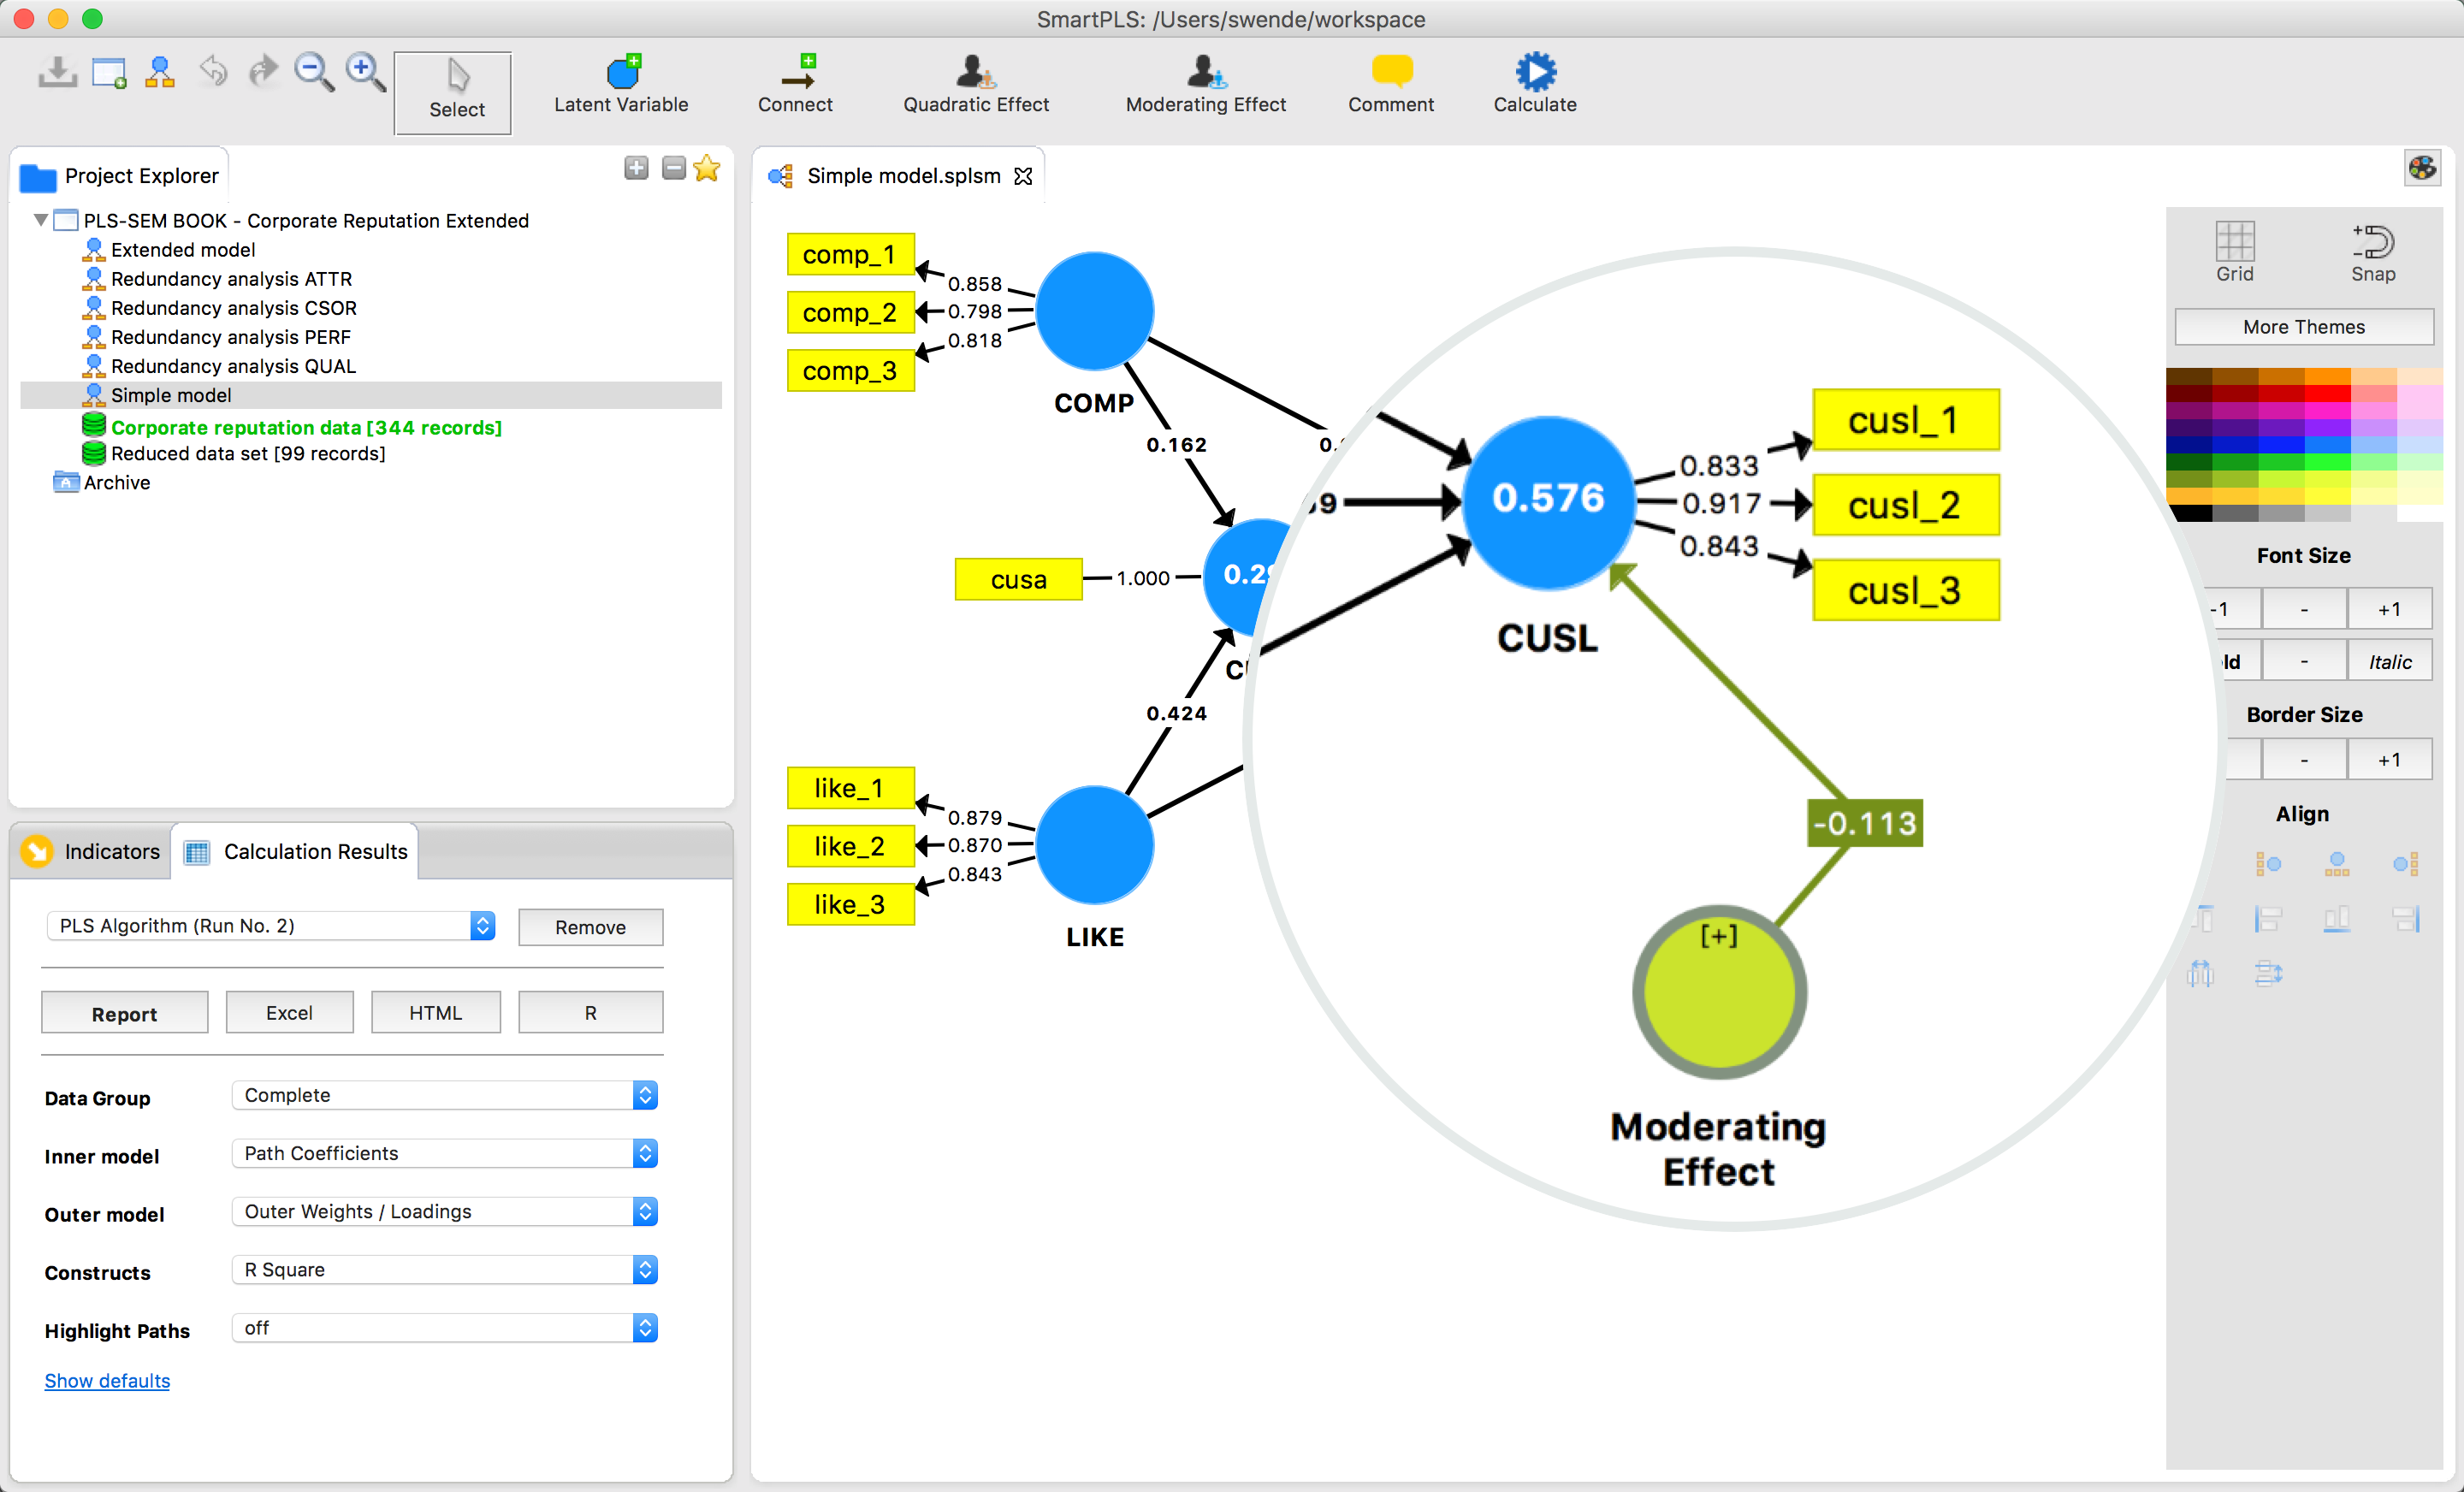
Customize your model with colors, borders and fonts to underline your ideas individually!
In-built explanations of the algorithms and meaningful defaults give you an easy start into the PLS-SEM world.
Well-organized reports provide full insights into your results.
Save your results permanently as HTML report or Excel file.
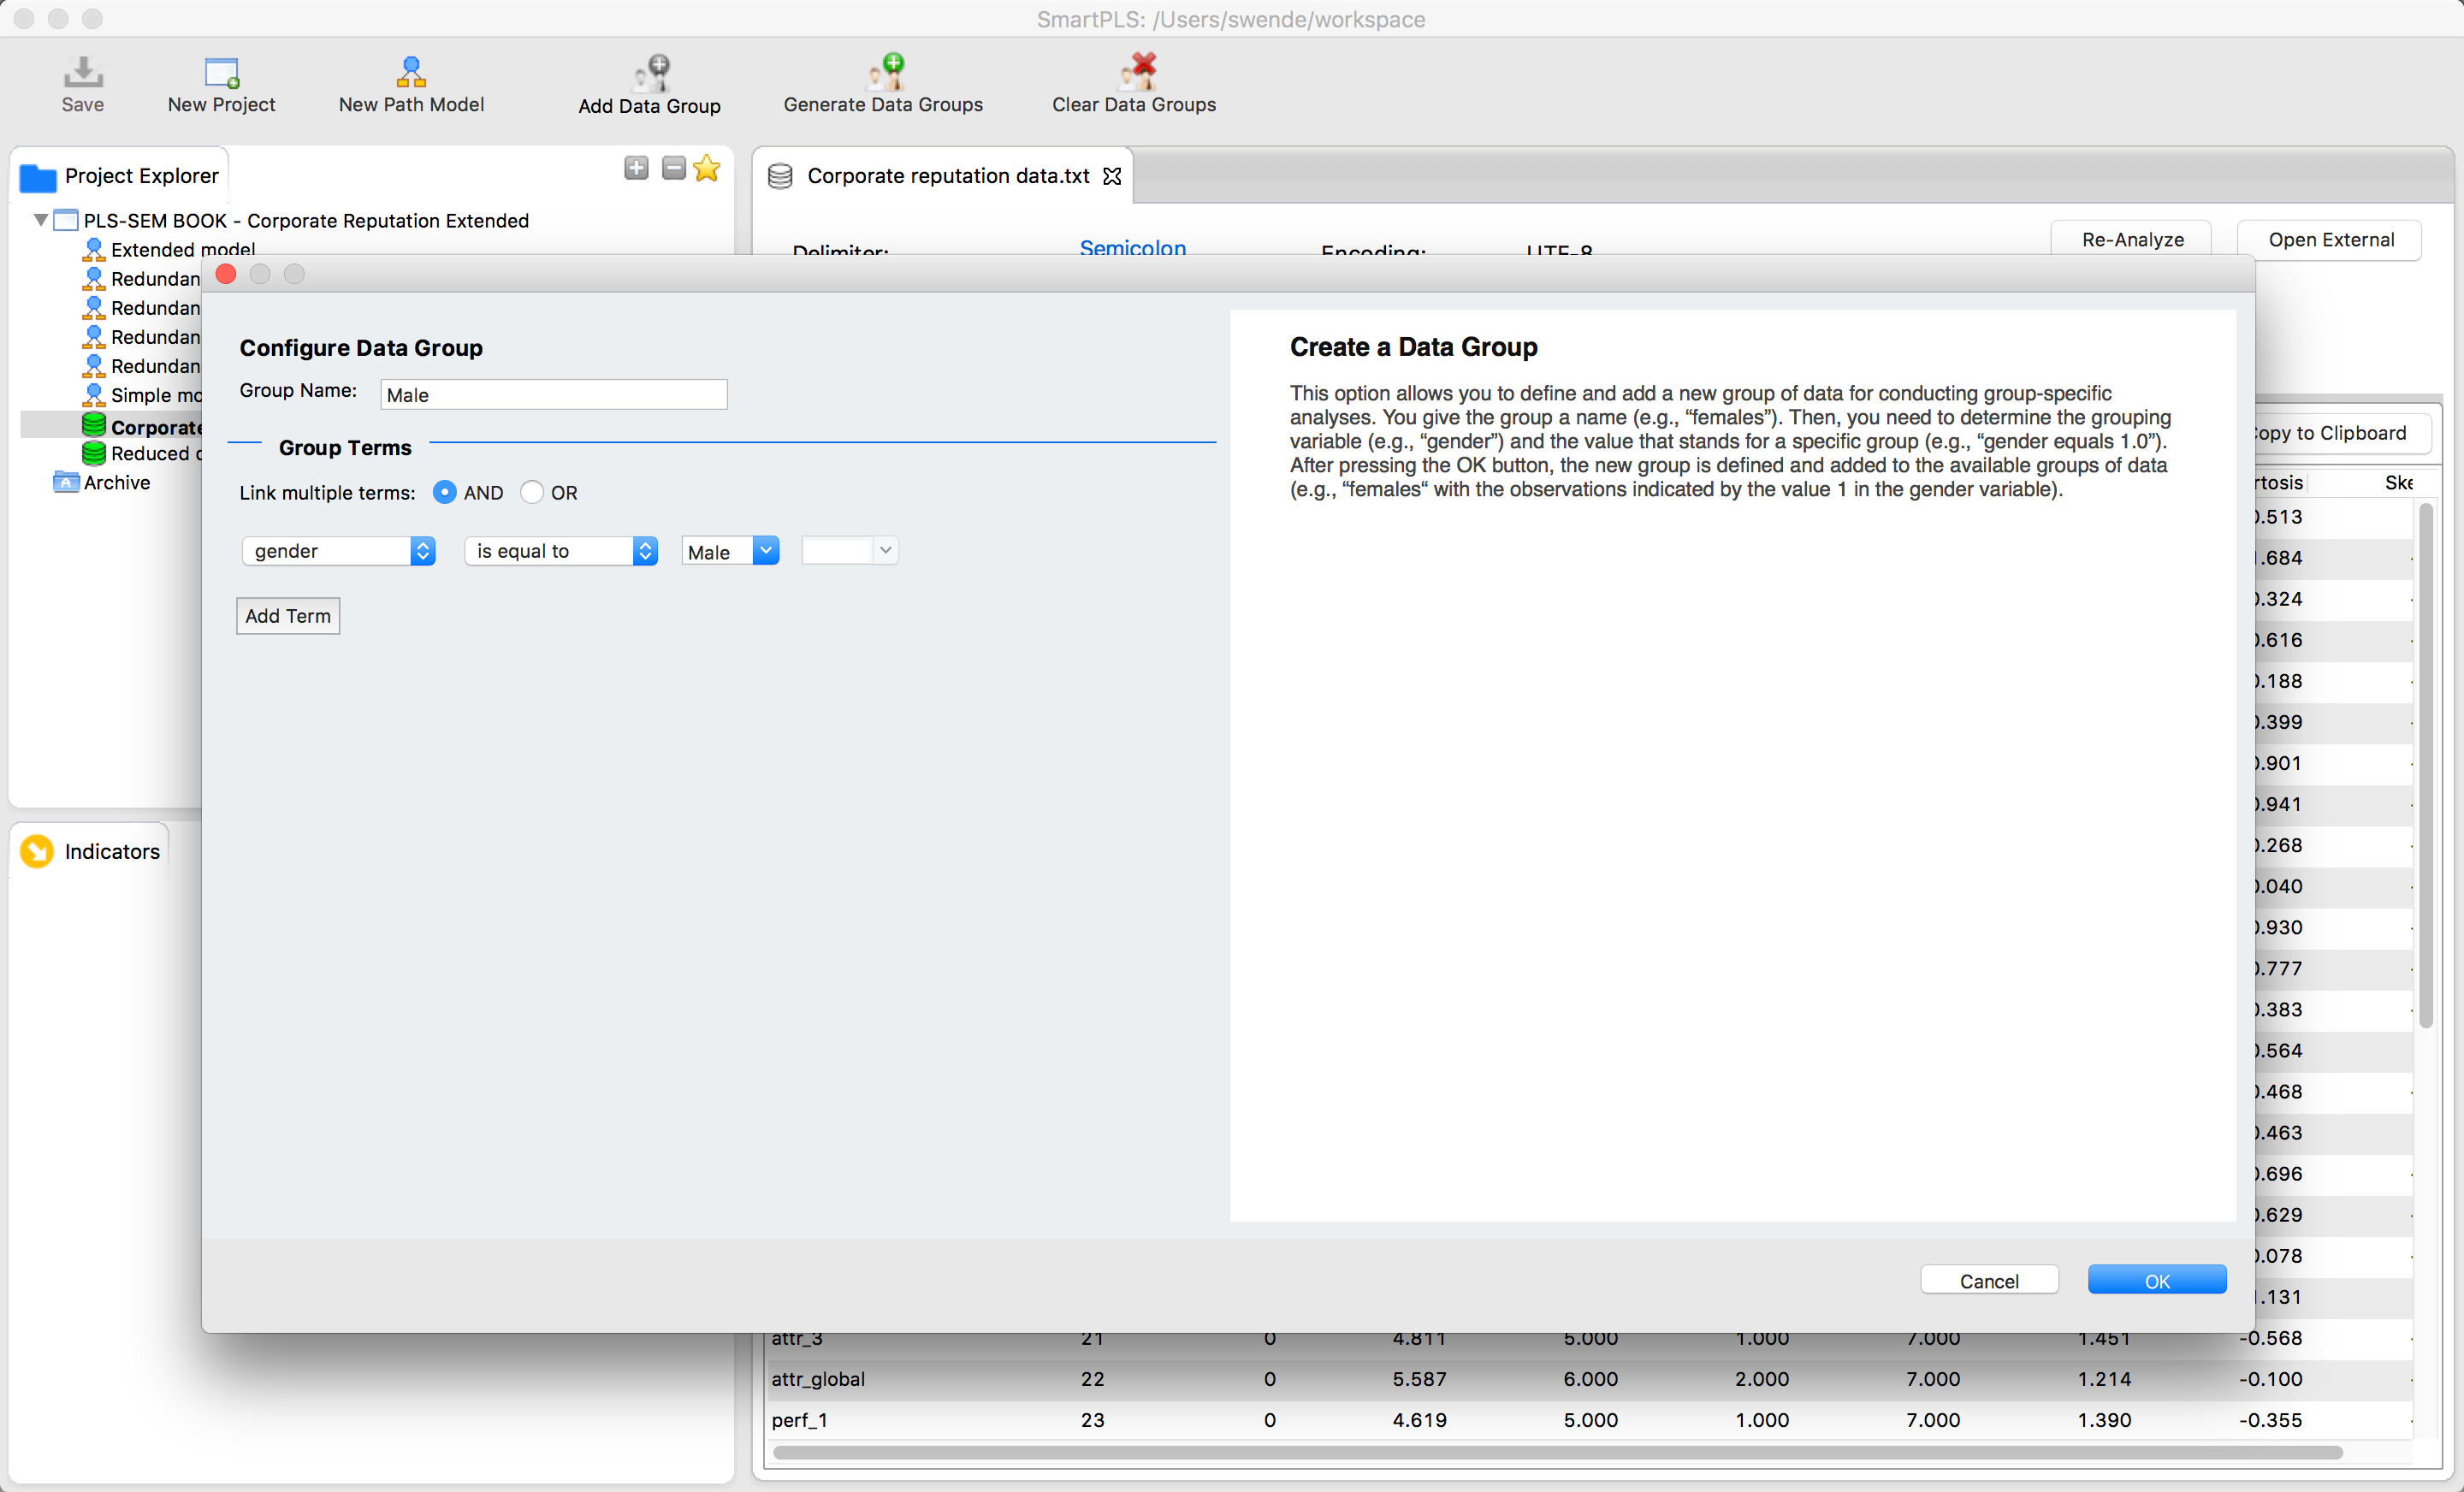
Create data groups to run multi group analyses effortlessly.
Create interaction terms and run moderator analyses without any problems.
