SPECTRAplus 是 研究機構和獨立實驗室的工程師,技術人員和科學家的首要選擇。無論何種應用,皆需要功能強大且具有成本效益的光譜分析測量系統。
SPECTRAplus 光譜管理軟體系統,為各種無線通信的規劃和管理提供了專業的工具 模組化的軟體結構 SPECTRAplus 系統是由一系列標準模組組成,具備極強的靈活性,並可根據使用者 的特殊情況調整配置,度身定製成一套行之有效的解決方案。
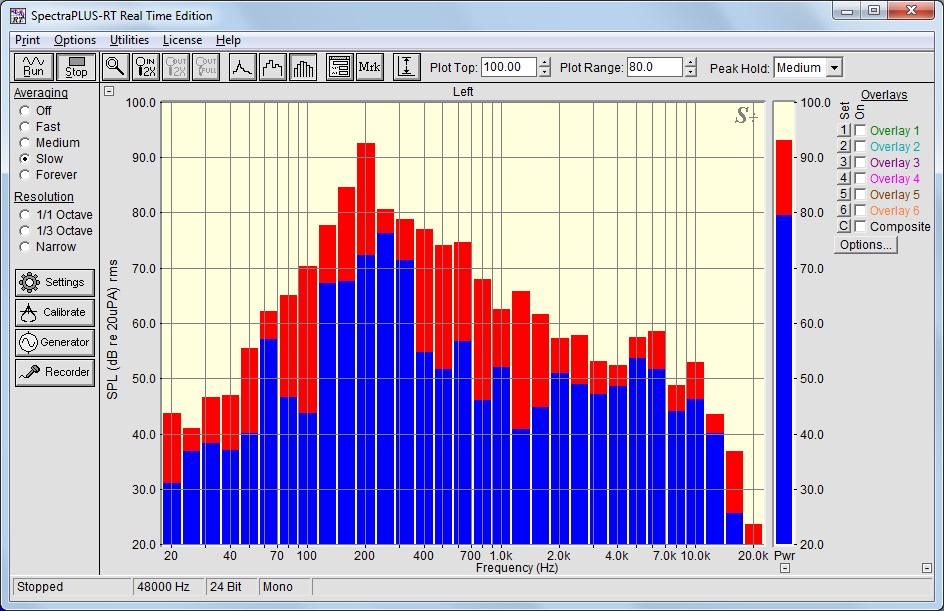
SpectraPLUS-RT Provides real time spectral analysis with Narrowband, 1/1 or 1/3 Octave resolution. Signal generation and recording/playback are also available. Designed for users needing a high quality spectrum analyzer with a minimal learning curve.
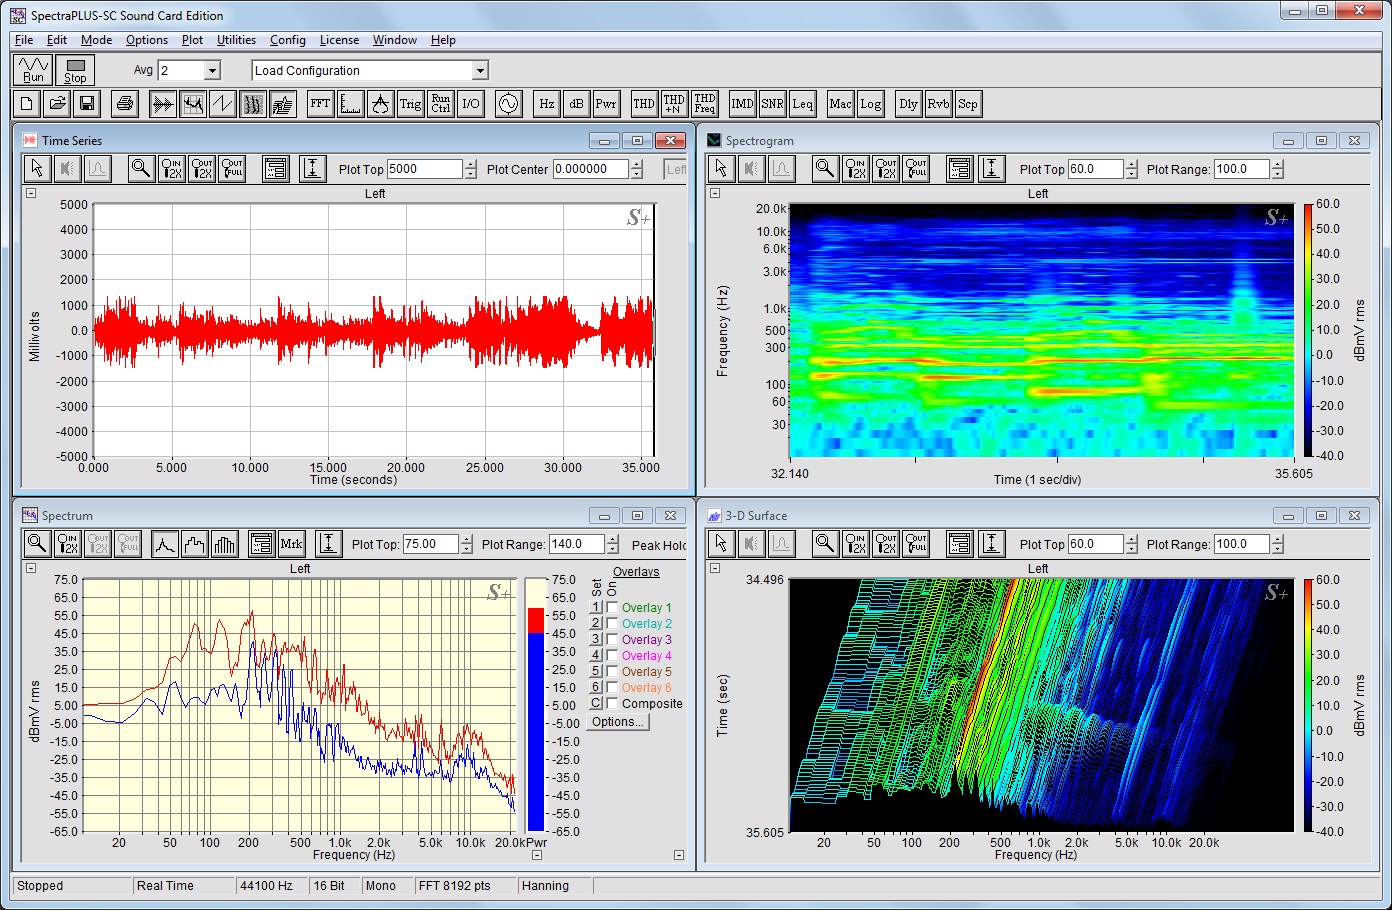
SpectraPLUS-SC Powerful dual channel signal analyzer with real time, recording/playback and post processing. Features a comprehensive set of displays for spectrum, time series and phase measurements as well as advanced joint time and frequency analysis (spectrogram and 3-D surface plots). A wide selection of tools and utilities for signal generation, distortion and reverberation measurements are available plus the ability to automate the analyzer for production testing or other needs. Triggering, Transfer functions and much more!
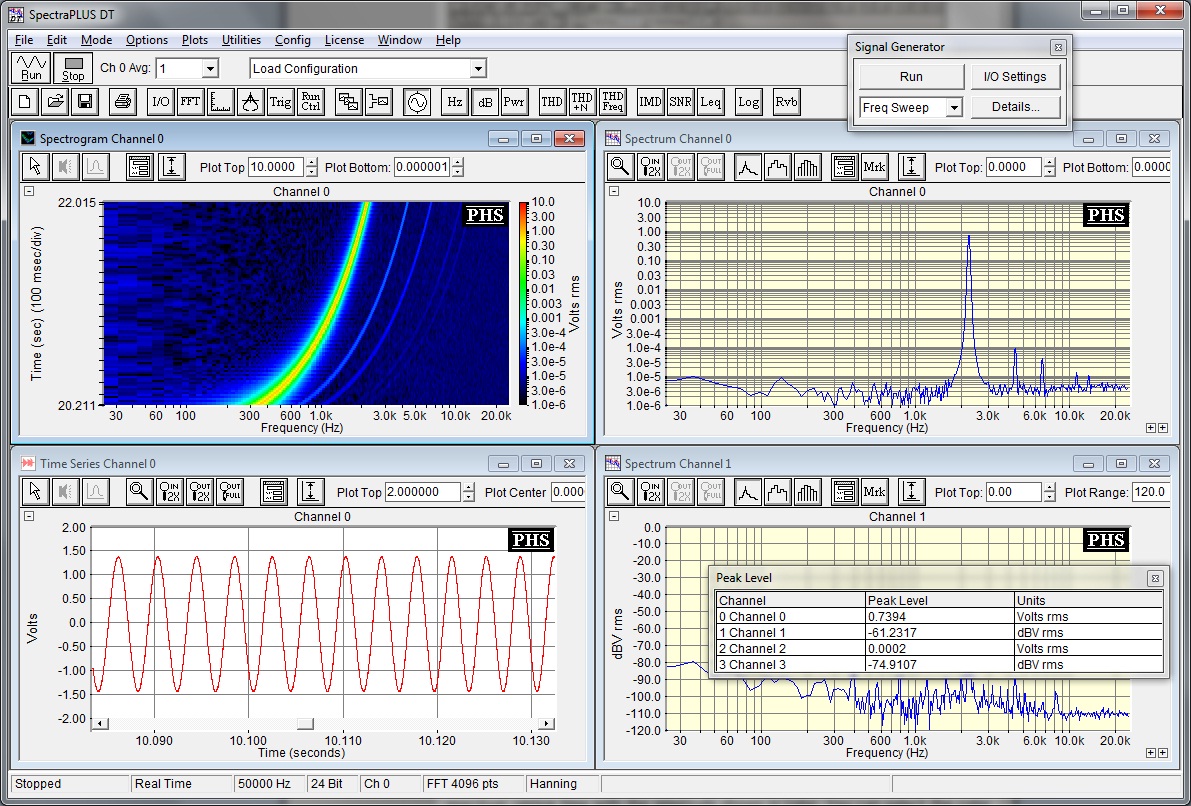
SpectraPLUS-DT is software package specifically designed around the Data Translation line of USB Data Acquisition modules. Up to 16 channels of acquisition and analysis with calibrated input levels, IEPE transducer power, AC or DC coupling and tachometer inputs. Data Translation offers a complete line of modules from low cost to high speed and high performance.
Typical Applications
- Audio equipment testing
- Vibration testing
- Distortion measurements
- Frequency Response tests
- Room Acoustic measurements
- Noise measurements and monitoring
- Precision signal generation
- Sound Power measurements
- Musical instrument manufacturing and testing
- Production testing
- Underwater acoustics, pile driving noise levels
- Rotating machinery analysis
- Impact hammer testing
Key Features
- Real-time spectrum analysis of live input
- Record, Playback and Post Process WAV files
- Displays: Time Series, Spectrum, Spectrogram, 3-D Surface, Phase
- Full Featured Dual Channel Signal Generator
- High Resolution FFT Analysis up to 1,048,576 pts
- Octave Analysis from 1/1 to 1/96 octaveSpectrogram
- Up to 24 bit sampling precision
- Digital Filtering, Distortion Analysis, Transfer Functions
- Acoustic Tools: RT60, Equivalent Noise Level (Leq)
- THD+N versus Frequency
- Acceleration, Velocity and Displacement
- Order Analysis
- Data Logging
- Advanced Programming API
SpectraPLUS-RT Product Options
SpectraPLUS-RT consists of a base analyzer plus 3 additional options - options can be purchased at anytime and activated with a simple phone call. The downloaded software includes all options for the 30 day evaluation period.
| Base Analyzer | Features include Single Channel Operation, Real Time Mode, Spectrum. Narrowband FFT, 1/1, and 1/3 Octave Scaling, Markers, Overlays, Averaging, Peak Hold, A, B, C Spectral Weighting. | |
| Option /01 | Dual Channel Processing | Dual Channel Operations - 2 channel analysis |
| Option /02 | Recorder Utility | Recorder and Playback from WAV files. Includes support for embedded calibration data. |
| Option /03 | Signal Generator Utility | Signal Generator - Pink Noise, White noise, Swept Sine, 1 kHz tone, Multiple Tones, and User Defined WAV source. Can generate different signals in each channel |
SpectraPLUS-SC Product Options
SpectraPLUS-SC consists of a base analyzer plus a set of 10 additional options so you can purchase only the features you need. Additional options can be purchased at anytime and activated with a simple phone call. The downloaded software includes all options for the 30 day evaluation period.
| Base Analyzer | Features include Single Channel Operation, Real Time Mode, Spectrum, Time Series, and Phase displays, Narrowband FFT sizes through 32,768 points, 1/1, and 1/3 Octave Analysis, Triggering, Markers, Overlays, Averaging, Peak Hold, Decimation, Mic Compensation, A, B, C Spectral Weighting | |
| Option /01 | Dual Channel Processing | Dual Channel Operations - Real and Complex Transfer Functions, Coherence, Average, Cross Spectrum and cross channel delay compensation |
| Option /02 | Recording and Post Processing Modes | Recorder and Post Processing modes - allows direct hard disk recording and playback. Post Processing mode provides comprehensive analysis from WAV files. Includes Digital Filtering capability |
| Option /03 | Signal Generator Utility | Advanced Signal Generation - Pink/White noise, Noise Burst, Frequency Sweep, Frequency Step, Level Sweep, 1 kHz tone, Multiple Tones, Saw, Square, Pulse, IMD test tones and User Defined WAV source. Can generate different signals in each channel |
| Option /04 | Color Spectrogram Display | Spectrogram View - displays the spectrum versus time in greyscale or color format for advanced joint time-frequency analysis. |
| Option /05 | 3-D Surface Display | 3-D Surface View - displays the spectrum versus time in a 3-Dimensional perspective format |
| Option /06 | Distortion Analysis Utilities | Distortion Analysis - measurement utilities for THD, THD+N, IMD, SNR, NF, SINAD. Each measurement is displayed in real time in a separate resizeable window. Also includes a dedicated THD+N versus Frequency utility that quickly and conveniently measures the distortion characteristics of your device over a range of frequencies. |
| Option /07 | High Resolution Analysis | Adds 24 bit sampling precision and sampling rates above 48kHz (sound card dependent). Adds FFT sizes up to 1,048,576 points, and Octave scaling to 1/96 |
| Option /08 | Advanced Scaling and Calibration | Adds independent channel calibration and scaling for left and right channels with separate views for each. Useful for applications requiring separate channel scaling and calibration such as simultaneous sound and vibration measurements. This option also includes calibration conversions from Acceleration to Velocity or Displacement; also adds Power Specral Density scaling option for accurate noise measurements |
| Option /09 | Acoustic Tools | Reverberation Time (RT60) utility features bar graph of reverberation time versus frequency band, 3-D Surface plot of the decay versus frequency and individual decay plots versus time. Delay Finder measures delay between two channels in milliseconds, feet or meters. Speed of sound - converts the delay value between milliseconds, feet or meters. Equivalent Noise (Leq) utility provides comprehensive noise level calculations for LeqT, Leq, Lpk , Lsel, Lmax, Lmin, L10, L50, L90. Stereo Phase Scope for real-time monitoring and analysis of signal phase. Phase scope mode displays a standard oscilloscope X-Y orientation (lissajous pattern) for analysis of phase, polarity, missing channel detection and stereo separation monitoring |
| Option /10 | Automation Tools | Macro Command Processor utility allows you to easily automate measurements, record SPL and spectral data at user specified intervals/duration with time/date stamp, save files with user-defined names using a script-based programming language. It uses the underlying DDE syntax for an automation solution without requiring a third party program. Automation interface API allows the capability for an external program to control and read results from the analyzer in real time. Works with any program that supports COM such as C++, VB, Excel, and others. Dynamic Data Exchange (DDE) allows the capability for an external program to control and read results from the analyzer in real time. Works with any program that supports DDE such as C++, VB, Excel, Access and others. Data Logging utility produces an output text file containing selected spectral parameters + time-stamp for dynamic signal tracking and unattended event monitoring. |
SpectraPLUS-DT Product Options
SpectraPLUS-DT consists of a base analyzer plus a set of 10 additional options so you can purchase only the features you need. Additional options can be purchased at anytime and activated with a simple phone call. The downloaded software includes all options for the 30 day evaluation period.
| Base Analyzer | Features include 16 channels, Real Time Mode, Spectrum, Time Series, and Phase displays, Narrowband FFT sizes through 32,768 points, 1/1, and 1/3 Octave Analysis, Triggering, Markers, Overlays, Averaging, Peak Hold, Decimation, Mic Compensation, A, B, C Spectral Weighting. | |
| Option /01 | Composite Channel Processing | Up to 16 Composite channels: Real and Complex Transfer Functions, Coherence, Multichannel Averaging, Cross Spectrum. Each composite channel can be separately configured and displayed in any or all of the spectrum plots (Spectrum, Phase, Spectrogram, 3-D Surface). |
| Option /02 | Recording and Post Processing Modes | Recorder and Post Processing modes - allows direct hard disk recording and playback of up to 16 channels. Post Processing mode provides comprehensive analysis from WAV files. Includes Digital Filtering capability |
| Option /03 | Signal Generator Utility | Advanced Signal Generation - Pink/White noise, Noise Burst, Frequency Sweep, Frequency Step, Level Sweep, 1 kHz tone, Multiple Tones, Saw, Square, Pulse, IMD test tones and User Defined WAV source. Can generate different signals in each channel. Generator can utilize either the Data Translation D/A channels or your sound card output (not all DT modules provide analog outputs) |
| Option /04 | Color Spectrogram Display | Spectrogram Plot - displays the spectrum versus time in greyscale or color format for advanced joint time-frequency analysis. Up to 16 spectrogram plots can be displayed |
| Option /05 | 3-D Surface Display | 3-D Surface Plot - displays the spectrum versus time in a 3-Dimensional perspective format. Up to 16 3-D Surface plots can be displayed |
| Option /06 | Distortion Analysis Utilities | DistortionAnalysis - measurement utilities for THD, THD+N, IMD, SNR, NF, SINAD. Each measurement is displayed in real time in a separate resizeable window. Also includes a dedicated THD+N versus Frequency utility that quickly and conveniently measures the distortion characteristics of your device over a range of frequencies |
| Option /07 | High Resolution Analysis | Adds FFT sizes from 65536 to 1,048,576 points, and Octave resolutions of 1/6, 1/9, 1/12, 1/24, 1/48, and 1/96 |
| Option /08 | Advanced Scaling, Calibration and Order Analysis | Calibration conversions from Acceleration to Velocity or Displacement. Power Spectral Density scaling option for noise measurements. Support for Tachometer input channel and RPM versus Time plots. Order Analysis - Spectrogram plot with Order vs RPM options and Spectrum Order Plot |
| Option /09 | Acoustic Tools | Reverberation Time (RT60) utility features bar graph of reverberation time versus frequency band, 3-D Surface plot of the decay versus frequency and individual decay plots versus time. Equivalent Noise (Leq) utility provides comprehensive noise level calculations for LeqT, Leq, Lpk , Lsel, Lmax, Lmin, L10, L50, L90. Sound Power Level measurement utility (ISO-3744) |
| Option /10 | Automation Tools | Automation interface API allows the capability for an external program to control and read results from the analyzer in real time. Works with any program that supports COM such as C++, VB, Excel, and others. Also includes a Data Logging utility which produces output text files (per channel) containing selected spectral parameters + time-stamp for dynamic signal tracking and unattended event monitoring. |
| Key Feature | SpectraPLUS-RT | SpectraPLUS-SC | SpectraPLUS-DT |
| Hardware Supported | Multimedia Sound Cards and SpectraDAQ-200 | Multimedia Sound Cards and SpectraDAQ-200 | Data Translation DT-9800 Industrial A/D modules |
| Maximum Sampling Rate | 200 kHz* | 200 kHz* | 10 MHz* |
| Maximum Channels | 2 | 2 | 16 |
| Maximum Sampling Precision | 24 bit* | 24 bit* | 24 bit* |
| Composite Channels (Transfer Function, Multichannel average, etc) | 0 | 1 | 16 |
| Supported Modes | Real Time | Real Time, Record/Playback, Post Process | Real Time, Record/Playback, Post Process |
| Available Displays | Spectrum | Time Series, Spectrum, Phase, Spectrogram, 3-D Surface | Time Series, Spectrum, Phase, Spectrogram, 3-D Surface |
| Frequency Resolution | Fixed FFT size, 1/1 Octave, 1/3 Octave | Selectable FFT size, 1/1 through 1/96 Octave | Selectable FFT size, 1/1 through 1/96 Octave |
| Input Gain | Variable* (4 fixed steps#) |
Variable* (4 fixed steps#) |
Fixed Steps* |
| Calibrated Inputs | Uncalibrated (Volts or Millivolts#) |
Uncalibrated (Volts or Millivolts#) |
Volts or Millivolts |
| Calibration to Transducer | Use external reference signal (use transducer sensitivity#) |
Use external reference signal (use transducer sensitivity#) |
Use actual transducer sensitivity or external reference signal |
| Transducer Power | Phantom* (IEPE#) | Phantom* (IEPE#) | IEPE* |
| Triggering | No | Analog Input | Analog or TTL with User Accept/Reject option |
| Tachometer channel support | No | No | Yes |
| Order Analysis | No | No | Yes |
| Automation Support | No | Yes | Yes |
| * Hardware dependent #When SpectraDAQ-200 is used |
System Requirements
- Vista, Win 7, Win 8/8.1, Win 10, Win11 (both 32 and 64 bit versions supported)
- 1GB RAM, 40MB hard disk space
- 1024 x 768 or greater display resolution
- Mouse or other pointing device
The screenshot below is of the main application window for SpectraPLUS-RT. All the frequently used settings are available on the sidebar for quick access - it is exceptionally easy to use.
The screenshot below is of the main application window for SpectraPLUS-SC. All the frequently used menu commands are now available on the toolbar for quick access. Test configuration files can be loaded directly from the toolbar and multiple plots can be viewed simultaneously - it is exceptionally easy to use.
The screenshot below is of the main application window for SpectraPLUS-DT.
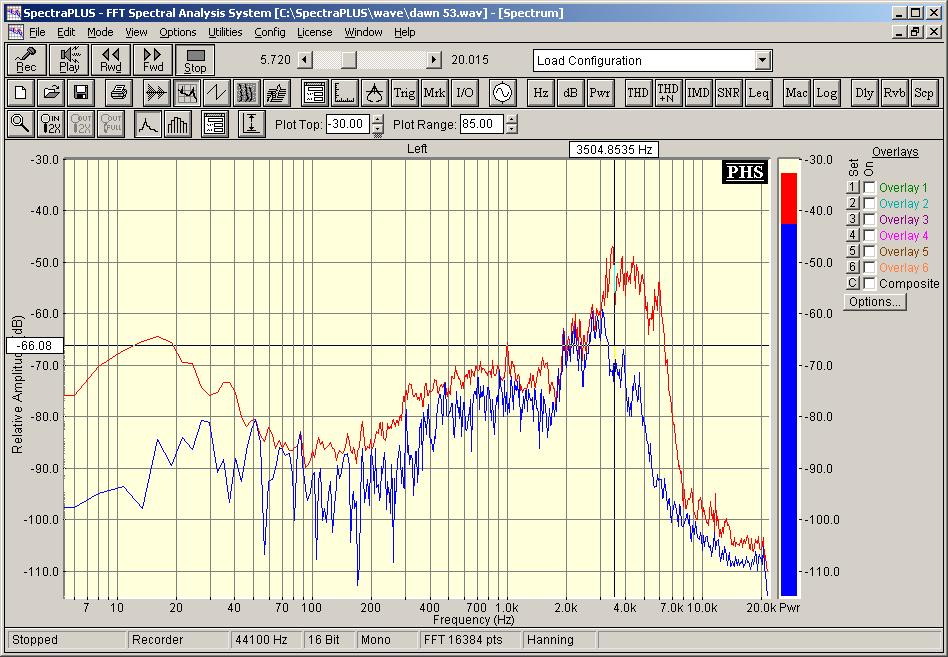
The screenshot below is of the Spectrum Display. This display is the workhorse of the analyzer and we have highly optimized its performance for quick updates and made it exceptionally easy to use. The example below shows several "overlays" where previous measurements have been saved and displayed together with the current spectrum. In addition, a differential cursor measurement are shown. You have complete control over scaling and labeling for all axis. The overlays can be saved and recalled from disk and labeled to meet your needs. This display is very fast - download the program and try it yourself!
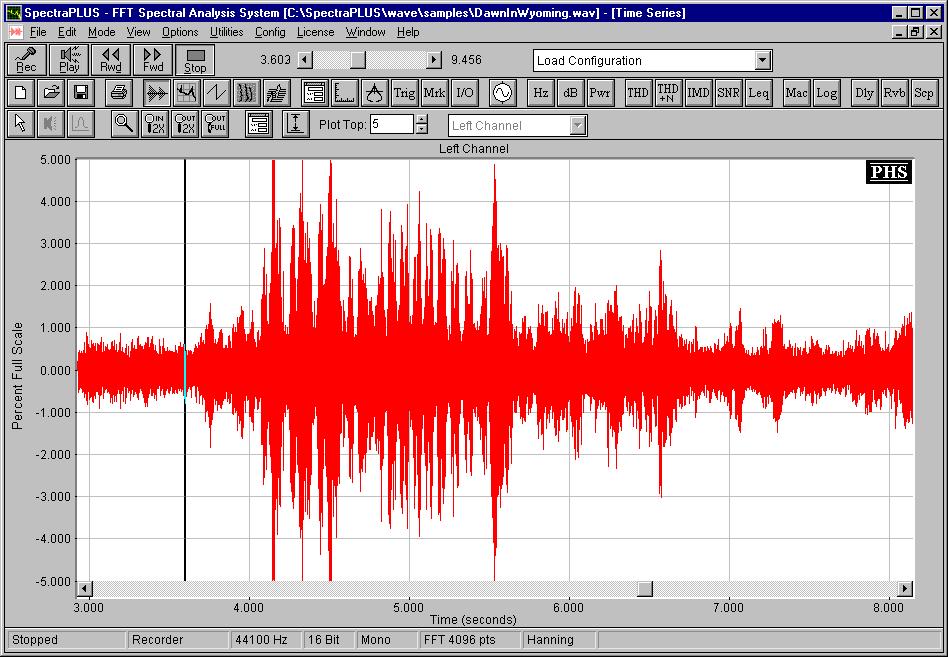
The screenshot below shows the Time Series display. Editing is supported in the Recording or Post Processing modes and full cursor measurements are provided.
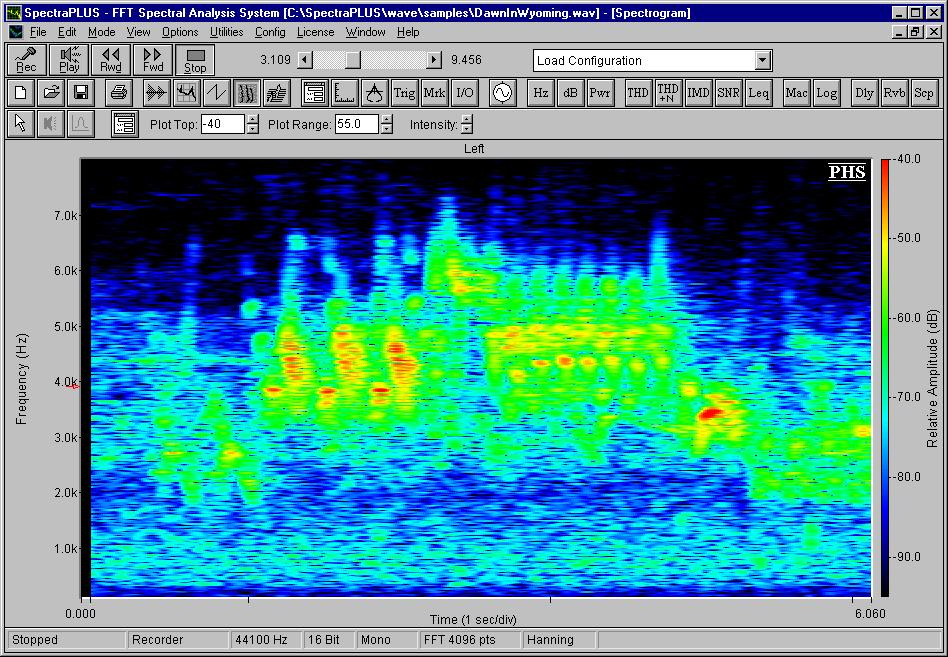
The screenshot below is of the Spectrogram display. This display shows the spectrum versus time with the amplitude shown in color. You can select the color gradient, scroll direction and many other parameters. Cursor measurements are supported on all axis. This display is one of the finest spectrograms available for the PC.
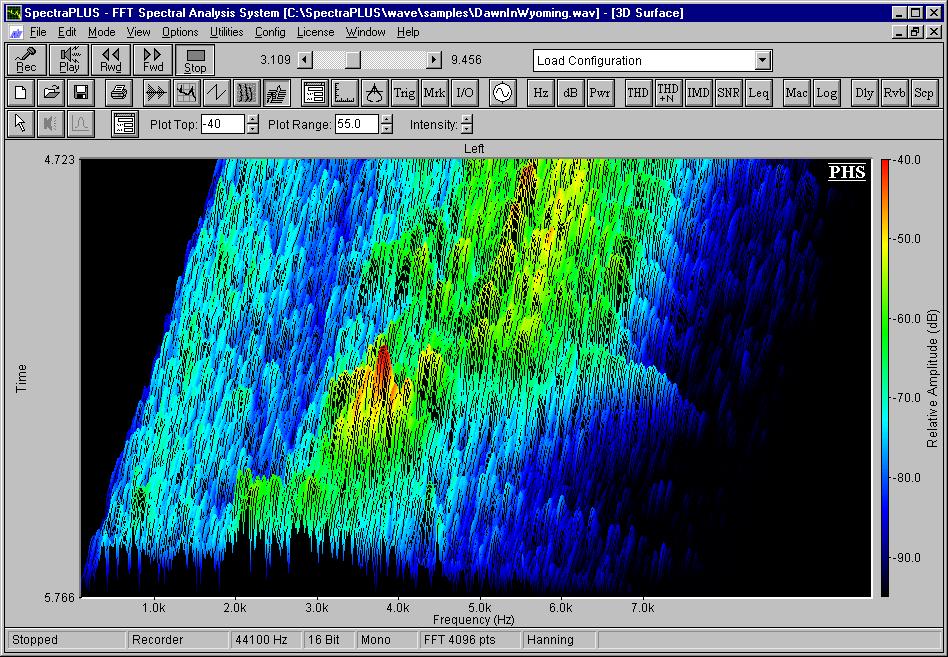
The screenshot below is of a 3-D Surface plot which shows a perspective view of the spectrum versus time.
