如果您在數學重工業,藥理學,醫學或社會學領域工作,並且每天進行複雜的統計分析,該怎麼辦?您是否找到了可在Mac上使用的用戶友好型數據分析工具?
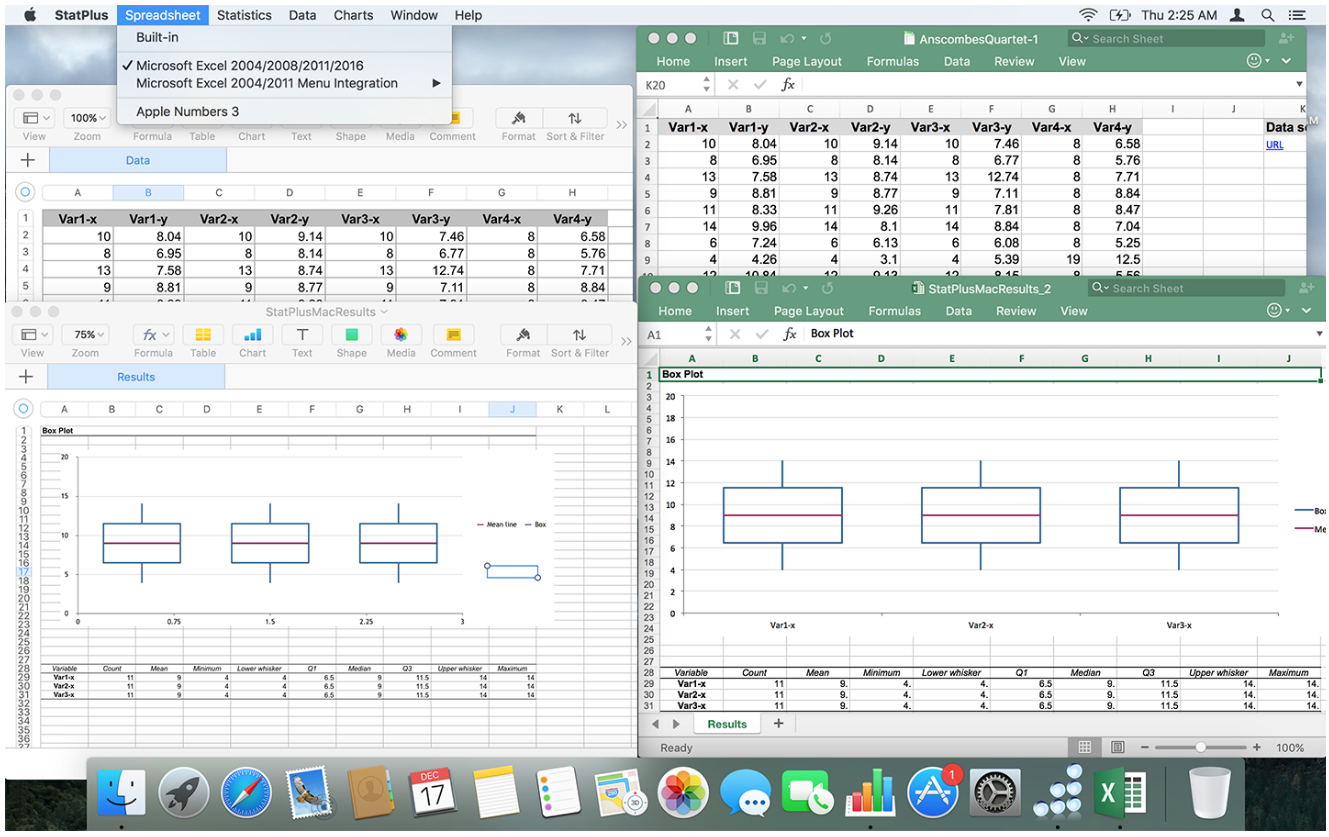
StatPlus:mac 可將您的Mac版Microsoft Excel(2004-2019)或Apple Numbers變成一個功能強大的統計工具,而無需您花很多錢來學習其他軟體或零件。您將使用熟悉的界面執行複雜的分析和計算,使您能夠專注於分析結果,而不用弄清楚如何實現這些結果。
升級電子表格
使用StatPlus:mac將Microsoft Excel或Apple Numbers轉換為功能強大的統計包,並在熟悉的環境中的Mac上執行數據分析。停止浪費時間學習新工具。
70多個功能
StatPlus:mac允許Mac用戶執行從基本到復雜的所有形式的數據分析,包括非參數和回歸分析,生存和時間序列分析以及多種其他方法。 版本7包含獨立的電子表格,可以在未安裝Microsoft Excel或Apple Numbers的情況下使用。
多平台
StatPlus:mac可用於Mac和PC平台(PC版本包括獨立版本和Excel加載項版本)。為您的PC和Mac混合環境節省學習時間和成本。
經濟實惠
StatPlus:mac是Mac上用於數據分析的最經濟實惠的解決方案(具有Excel和Numbers支持)。您將受益於減少的學習曲線和有吸引力的價格,同時享受精確的例程和計算的好處。
Pro Features
- Standalone spreadsheet with Excel (XLS and XLSX), OpenOffice/LibreOffce Calc (ODS) and text documents support.
- 'Add-in' mode for Excel 2004, 2008, 2011, 2016, 2019 and 2021.
- 'Add-in' mode for Apple Numbers.
- Priority support.
- Permanent license and free major upgrades during the maintenance period.
- Access to Windows version.
- Options to emulate Excel Analysis ToolPak results and migration guide for users switching from Analysis ToolPak.
Basic Statistics
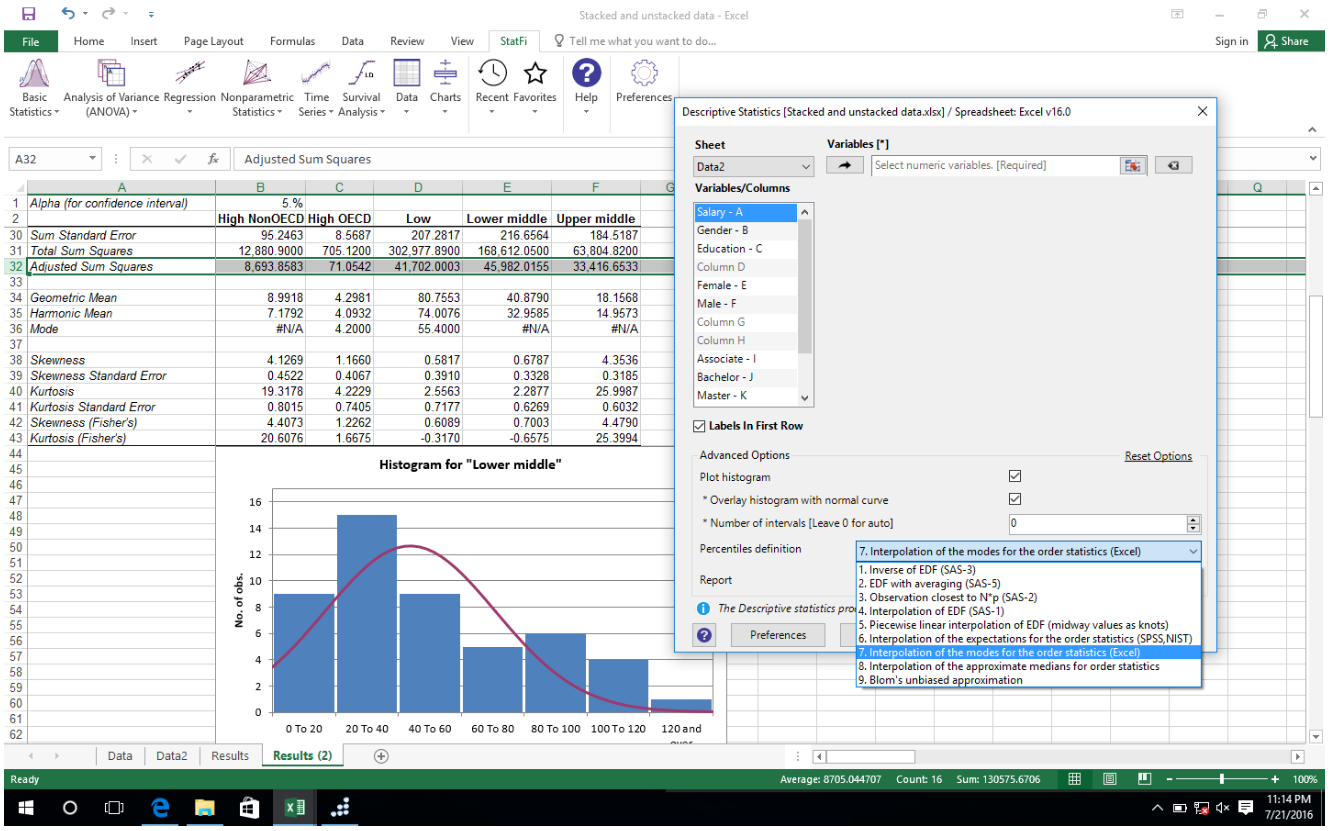
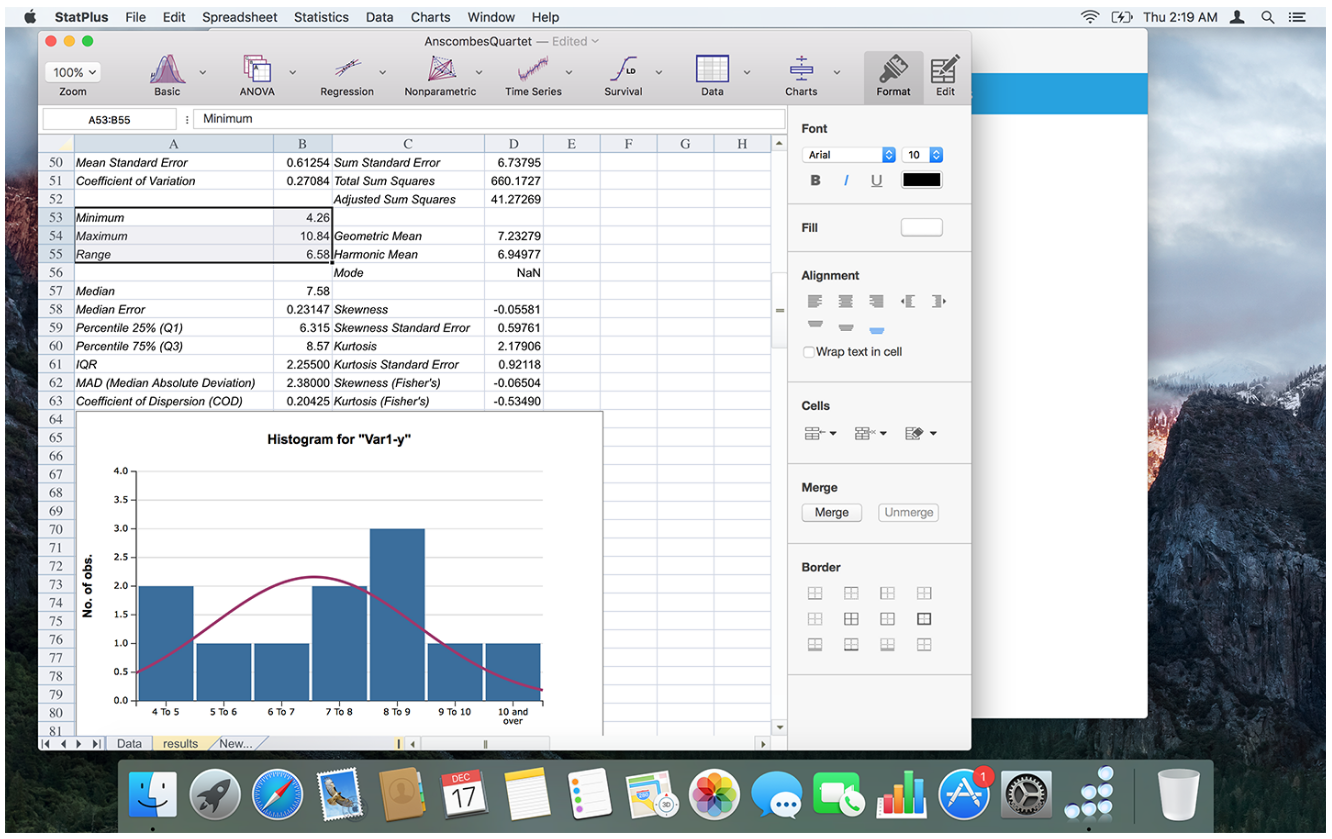
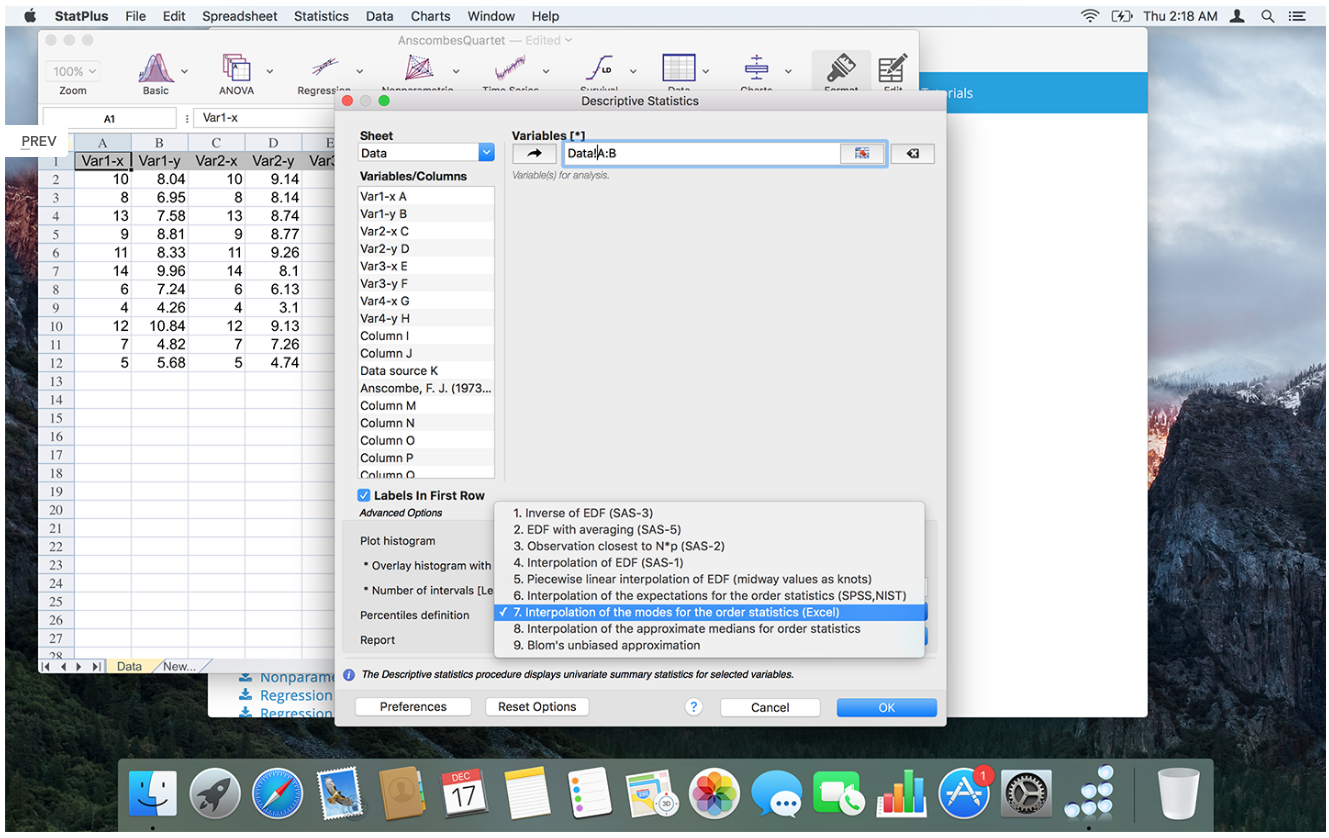
- Detailed descriptive statistics.
- One-sample t-test.
- Two-sample t-test.
- Two-sample t-test for summarized data.
- Fisher F-test.
- One-sample and two-sample z-tests.
- Correlation analysis and covariance.
- Normality tests (Jarque-Bera, Shapiro-Wilk, Shapiro-Francia, Cramer-von Mises, Anderson-Darling, Kolmogorov-Smirnov, D'Agostino's tests).
- Cross-tabulation and Chi-square.
- Frequency tables analysis (for discrete and continuous variables).
- Multiple definitions for computing quantile statistics.
Analysis of Variance (ANOVA)
- One-way and two-way ANOVA (with and without replications).
- Three-way analysis of variance.
- Post-hoc comparisons - Bonferroni, Tukey-Kramer, Tukey B, Tukey HSD, Neuman-Keuls, Dunnett.
- Within subjects ANOVA and mixed models.
Multivariate Analysis
- Principal component analysis (PCA).
- Factor analysis (FA).
- Discriminant function analysis.
- Hierarchical Clustering and K-Means.
Nonparametric Statistics
- 2x2 tables analysis (Chi-square, Yates Chi-square, Exact Fisher Test, etc.).
- Rank and percentile.
- Chi-square test.
- Rank correlations (Kendall Tau, Spearman R, Gamma, Fechner).
- Comparing independent samples
- Mann-Whitney U Test, Kolmogorov-Smirnov test, Wald-Wolfowitz Runs Test, Rosenbaum Criterion. Kruskal-Wallis ANOVA and Median test.
- Comparing dependent samples
- Wilcoxon Matched Pairs Test, Sign Test, Friedman ANOVA, Kendall's W (coefficient of concordance).
- Cochran's Q Test.
Regression Analysis
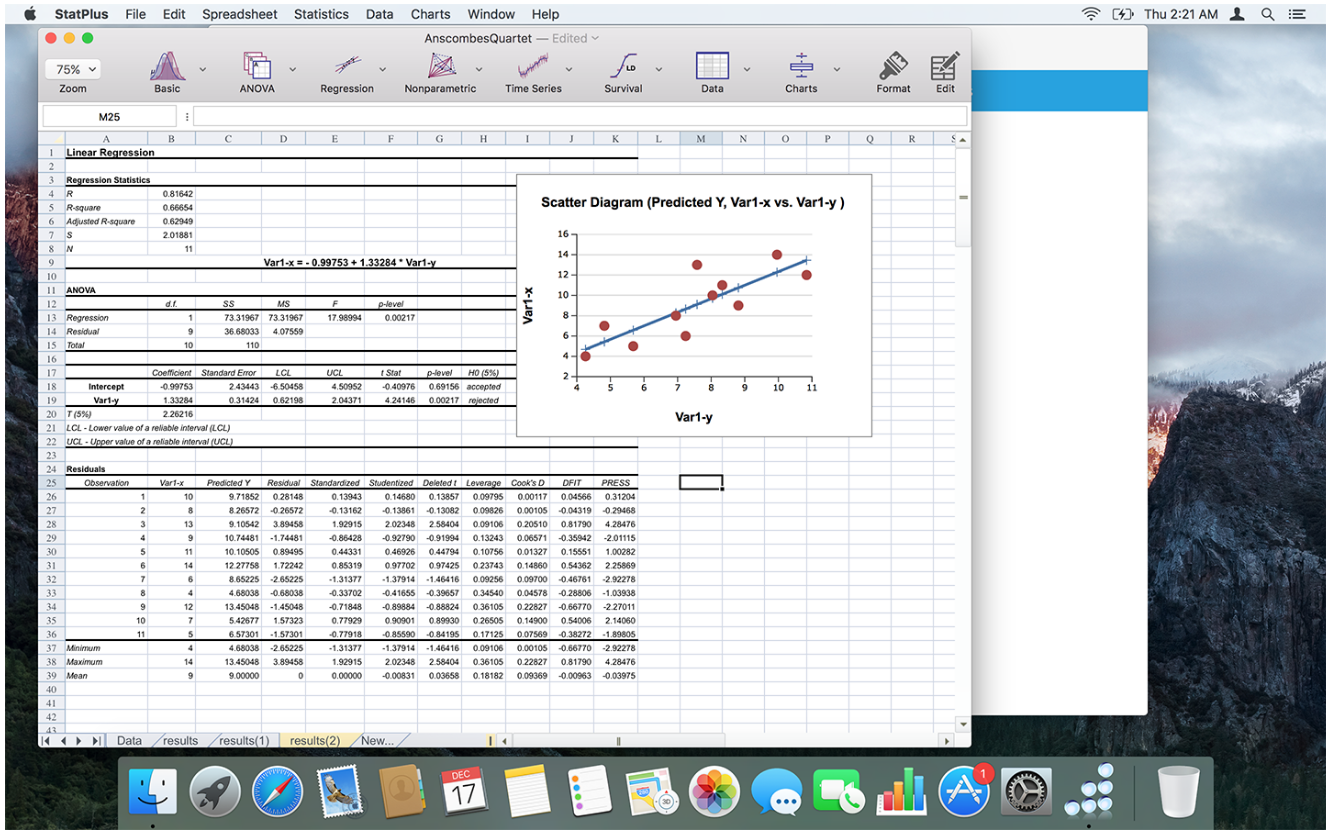
- Multivariate linear regression (residuals analysis, collinearity diagnostics, confidence and prediction bands).
- Weighted least squares (WLS) regression.
- Logistic regression.
- Stepwise (forward and backward) regression.
- Polynomial regression.
- Curve fitting.
- Tests for heteroscedasticity: Breusch–Pagan test (BPG), Harvey test, Glejser test, Engle's ARCH test (Lagrange multiplier) and White test.
Time Series Analysis
- Data processing.
- Fourier analysis.
- Smoothing.
- Moving average.
- Analysis.
- Autocorrelation (ACF and PACF).
- Interrupted time series analysis.
- Unit root tests - Dickey–Fuller, Augmented Dickey–Fuller (ADF test), Phillips–Perron (PP test), Kwiatkowski–Phillips–Schmidt–Shin (KPSS test).
Survival Analysis
- Life tables.
- Kaplan-Meier (log rank test, hazard ratios).
- Cox proportional-hazards regression.
- Probit-analysis (Finney and LPM).
- LD values (LD50/ED50 and others), cumulative coefficient calculation.
- Receiver operating characteristic curves analysis (ROC analysis).
- AUC methods - DeLong's, Hanley and McNeil's. Report includes: AUC (with confidence intervals), curve coordinates, performance indicators - sensitivity and specificity (with confidence intervals), accuracy, positive and negative predictive values, Youden's J (Youden's index), Precision-Recall plot.
- Comparing ROC curves.
Data Processing
- Sampling (random, periodic, conditional).
- Random numbers generation.
- Standardization.
- Stack/unstack operations.
- Matrix operations.
Statistical Charts
- Histogram
- Scatterplot.
- Box plot.
- Stem-and-leaf plot.
- Bland-Altman plot.
- Bland-Altman plot with multiple measurements per subject.
- Quantile-quantile Q-Q plots for different distributions.
- Control charts - X-bar, R-chart, S-chart, IMR-chart, P-chart, C-chart, U-chart, CUSUM-chart.
Requirements
StatPlus:mac requires macOS 10.10 or newer. Latest builds support macOS 12 Monterey and Apple M1 chip. StatPlus:mac supports Microsoft Excel for Mac (supported versions: 2004, 2008, 2011, 2016, 2019, 2021) and Apple Numbers as a data source. StatPlus:mac does not require Internet connection (except for optional auto-update feature).
StatPlus for Windows
借助StatPlus,您可以獲得一套強大的統計工具和圖形分析方法,可以通過簡單直接的界面輕鬆訪問。StatPlus的可能應用範圍幾乎是無限的-社會學,財務分析,生物統計學,經濟學,保險業,醫療保健和臨床研究。
儘管StatPlus是專業的統計分析工具,但其界面非常簡單,即使不了解統計信息的人也可以處理數據,只要他們知道如何使用PC並給出明確的指令即可。這就騰出了用於分析結果的智力資源,而不是為誰和如何處理數據以及在處理過程中是否犯了任何錯誤而苦惱。
強大的電子表格
獨立版本可讀取多種文本格式,Microsoft * Excel * 97-2003(XLS)和2007-2019(XLSX)工作簿,SPSS *文檔(最高v22),並支持幾乎所有Excel內置工作表功能(數學,統計,財務)。StatPlus帶有Excel加載項(StatFi),可將Excel轉換為統計軟體包。第5版包括自己的圖表引擎(直方圖,條形圖,面積圖,點圖,餅圖,統計圖,控製圖),並讀取StatSoft * Statistica *文檔。
統計AZ
StatPlus允許執行各種形式的分析-從數據轉換和採樣到復雜的分析,包括非參數和回歸分析,生存分析以及多種其他方法。
多平台
StatPlus可用於PC和Mac平台。兩種版本均包含獨立的電子表格和Excel加載項。為您的PC和Mac混合環境節省學習時間和成本。
系統需求
StatPlus requires Windows 2000 or newer, Windows 8 or newer recommended. Excel add-in (StatFi) requires Excel 2007 or newer. StatPlus supports Windows 11 and Excel 2021.
