TeeChart VCL/FMX
TeeChart Pro 圖表組件庫提供數百種用於資料視覺化的 2D 和 3D 圖形樣式、60 種數學、統計和財務函數供您選擇,以及無限數量的軸和 30 個調色板組件。
特色
One source for cross-platform
Targeting Windows, Web and Mobile Apps
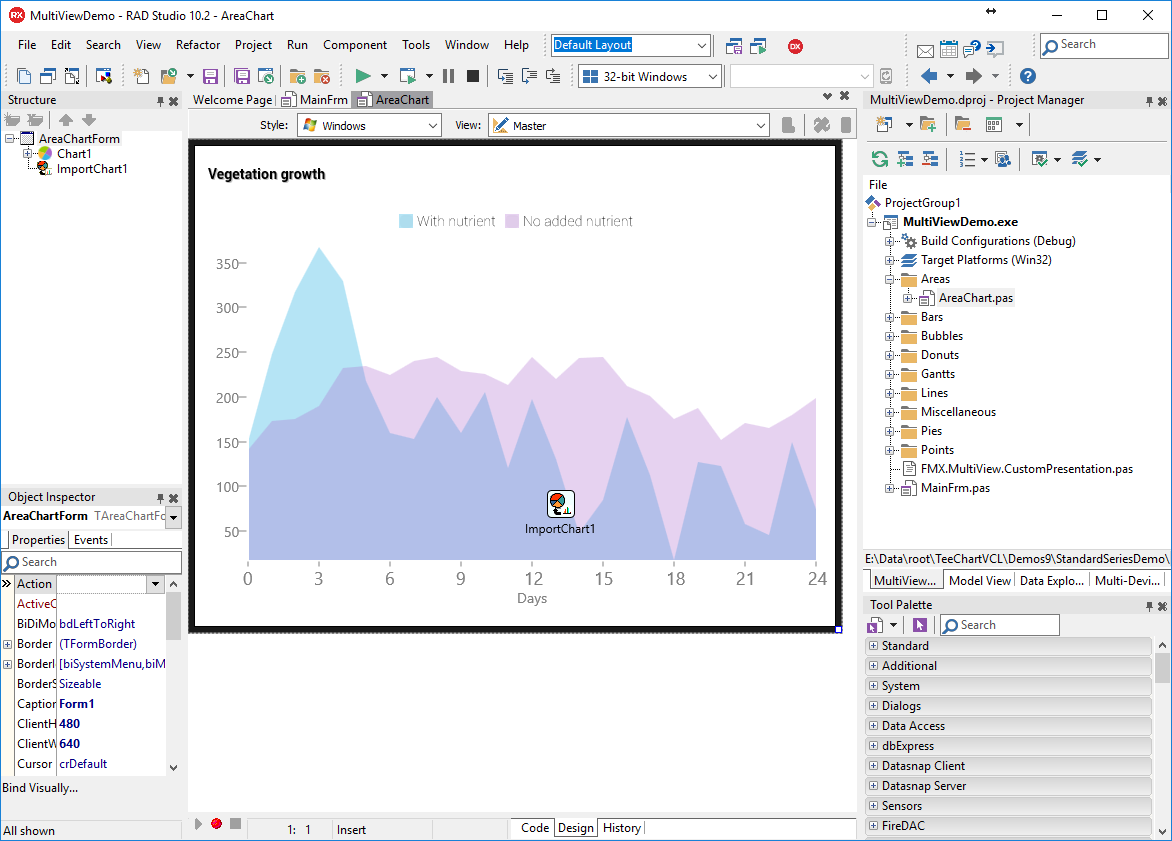
Create one multi-platform project using Embarcadero's RAD Studio and by using the same chart component you can reach Windows, Linux, iOS, Android and macOS.
Design the forms in the IDE and build/run them to any of the platforms on the list.
You can also use TeeChart (sourcecode version only) with FMXLinux to port/build your charting applications to/for Linux with Embarcadero Delphi 10.2 Tokyo and up.
Responsive charts
Deliver dashboards easily to multi-device/multiple platforms with FireMonkey
TeeChart will scale and fit to any screen size. If you're building dashboards you can place multiple, resizeable charts on each dashboard panel. FireMonkey framework will handle most of the variations for the different platforms. See chart examples showing how to use TeeChart for FireMonkey apps.
Charts for every industry
Business, financial and scientific data
The VCL component offers an immense array of charts to display your data in the most effective and manageable way. Over 70 chart types with 2D and 3D views - from common bar, line, area graphs to financial and statistical charts. See GitHub where you will find a repository of chart examples.
Gauges easily customized
Interactive gauge indicators including circular, linear and digital gauges
The Chart component provides many gauges series type and indicators to create digital dashboards with visual effects like shadows, lighting, etc.
Dashboard and Reporting
Build informative dashboards with the data visualisation tools
This Delphi FireMonkey project provides a dashboard report containing charts, grid and map. It uses several TeeChart features in order to interact between the different chart and grid, as well as some chart tools. The dashboard represents the sales activities of a company with products in several markets around the globe.
版本比較 (點擊圖片可放大觀看)
程式截圖 (點選圖可放大觀看)
TeeChart ActiveX 圖表組件庫提供了數以百計的 2D 和 3D 圖形風格,54 種數學和統計功能,連同無限數量的座標軸和 14 個工具箱元件。 TeeChart Pro ActiveX 圖表組件可以有效地用於創建多任務之儀表板。
特色
Server and Client components
Use the full power of the TeeChart ActiveX Control on the server: Database enabled and with all export formats for use in your ASP, ISAPI, CGI or MTS application. Direct stream output as a browser independent format or the lightweight AX client control for AX aware Browsers, with a fully navigable, event driven Chart to work interactively with server sourced data.
ASP/IIS
Now even stronger support for ASP and ASPX ! Export formats include: JPEG, GIF, PNG, EPS, PDF, Native Tee, BMP, WMF, EMF and, of course, live Charts on the browser with the tab. Charts may be streamed directly to the browser to avoid maintenance of temporary files. It includes extensive code examples to guide the way.
ADO
Inbuilt support for Microsoft's ActiveX Data Objects. Plug in to external Recordsets or create them with the Chart Editor.
Output formats
TeeChart renders in most popular Graphics formats including JPEG, PNG and WMF/EMF and also generates Flex compiled code for on-the-fly Flash image generation, live with inline animations.
Fast speed and small memory size consumption.
TeeChart graphical code speaks directly to Windows GDI API. Data is stored in dynamic arrays that are very closely mapped to memory which makes access and modifying the arrays almost as fast as the computer processor. The code is streamlined as much as possible to increase internal speed, especially when re-drawing.
Easy to use at design and run-time.
TeeChart includes powerful and complete editor dialogs, for almost every component and sub-component. These editors are available at design-time and also at run-time. The TeeCommander component (a toolbar with charting specific buttons) provides one-click access to TeeChart editors and common features.
Huge documentation and examples.
The help file and documentation include a reference guide, a user guide, tutorials with detailed "how to" explanations, end-user help and a comprehensive example project (with complete sources) that contains nearly 400 forms. Pressing F1 gives context help for almost all screens and source code elements.
Translations into several languages and Unicode suppoort.
TeeChart offers 25 Editor languages and is Unicode compliant for multi-characterset support, including double-byte languages, for true global application development.
"teeChart Pro, 21st century charting"
TeeChart for .NET 是 Steema 軟體的最新增加的得獎的 TeeChart 圖表工具,支援 Visual Studio.NET 平台和 Borland C# Builder。就像 TeeChart 的 Pro 版本一樣,TeeChart for .NET 因其強大的功能而廣受好評,它擁有好幾百種 2D 和 3D 圖形風格、33 種數學和統計功能。內置資料庫並支援桌面系統和伺服器系統的多種資料格式匯出、支援 ASP.NET 和 PocketPC/WinCE 應用中使用,TeeChart for .NET 是圖表元件世界裡的典型產品。TeeChart for .NET 包括 Windows desktop、ASP.NET腳本、WebForm 和 PocketPC 例子。
特色
IDE’s Supported and Compatibility
- Fully exploits Microsoft.NET Framework 2.0, 3.5, 4.xx, .NET Standard /.NET Core 2 & 3 on Winforms, WPF & ASP.NET, .NET 5, .NET 6, .NET 7, .NET 8
- ASP.NET Framework 2.0 and higher
- Windows Presentation Foundation (WPF)
- Compatible with Microsoft Visual Studio: 2005, 2008, 2010, 2012, 2013, 2015, 2017, 2019, 2022
- Components for WinForms, WebForms, MVC
- Universal Windows Platform (UWP)
- HTML5 support browsers
- Ajax clientside WebChart processing
Mobile Platforms Support
Support for Microsoft Windows Phone.
Enterprise Edition and Full C# sourcecode version include TeeChart for Xamarin.Android, TeeChart for Xamarin.iOS and TeeChart for Xamarin.Forms products.
Chart types
60+ chart types and variations. From the commonly used Line, Bar, Area, Pie to those more “field-specific charts” such as Candlestick, Open-High-Low-Close, Kagi and Contour.
Includes:
- Standard: Line (Strip), Bar, Area, Pie, Fast Line, Point (Scatter), Bubble, Arrow, Gantt, Shape, Horiz.Area, Horiz.Bar, Horiz.Line, Pointer style Hexagon
- Financial: Candle (OHLC), Darvas, Kagi, Renko, Point and Figure, Volume, EquiVolume
- Statistical: Box-Plot, Color Grid, Error, Error Bar, Error Point, Funnel (Pipeline), HighLow, Histogram, Volume Pipe, Waterfall, Horiz. BoxPlot, Horiz. Histogram
- Extended: 3D Vector, Bezier, Contour, Donut, IsoSurface, Map GIS, Organizational Chart, Polar, Polar Grid, Point 3D, Pyramid, Radar, Smith, Surface, TreeMap, Tri.Surface, Tower
- Other: Bar 3D, Bar-Join, Calendar, Clock, Image Bar, Image Point, My Point, TagCloud, Wind-Rose, BubbleCloud
Gauges
Gauges series type and indicators (dynamic Gauges, Circular, Linear, Numeric, Knob or Combination). TeeChart's Gauges are completely configurable to give you full control of format, size, colour and shape for your dashboard application.
Maps
Provides library of map series with support for ESRI open standard map formats.
Functions and Indicators
50+ financial and statistical indicators including:
- Standard: Add, Subtract, Multiply, Divide, Count, Average, High, Low, Median Function, Percent Change
- Financial: ADX, AC, Alligator, AO, ATR, Bollinger Bands, CCI, CLV, Compression OHLC, Exp. Average, Exp. moving average, Gator Oscillator, Kurtosis, MACD, Momentum, MomentumDiv, Money Flow, OBV, PVO, RSI, RVI, Slope, Smoothed Mov Avg, S.A.R Function
- Statistical: SPC Charts, Histograms, Skewness
- Extended: Cross points, Correlation, Cumulative, Custom y=y(x), Exponential Trend, Fitting linearizable models, Performance, Perimeter, Polynomial fitting, Finding coefficients, Reducing number of points, DownSampling, RMS, Smoothing function, Std Deviation, Trendline, Variance
Data Connectivity
You can easily create and/or connect to an existing database or dataset in your project.
Data aware
Direct access to .NET data sources. Direct access to URL addressable Charts.
Custom Chart Tools
TeeChart includes a set of 43 tools.
Annotation, ChartImage, ExtraLegend, GridBand, GridTranspose, MarksTip, NearestPoint, PageNumber, Pie, LegendScrollBar, SeriesAnimation, SurfaceNearest, Rotate, Cursor, DragMarks, AxisArrow, ColorLine, ColorBand, DrawLine, DragPoint, Gantt, AxisScroll, Zoom, Scroll, Light, Fibonacci, SubChart, Marker, Fader, Rectangle, Selector, SeriesRegion, LegendPalette, SeriesStats, SeriesTranspose, DataTable, ClipSeries, Banner, CustomHotspot, AxisBreaks, ScrollPager, FullScreen, CycleLines.
Palette components
The Palette provides access to 30 toolkit-specific components including ChartGrid, Navigators, Web source and Control Bar.
Chart image filters
You have control over the aesthetics of the charts with a set of 25 image filters.
Exporting Formats
You can easily export charts as images (bitmap, metafile, JPEG, PNG, GIF, TIFF, PDF, SVG, EPS and native Chart format) and as data to Excel, XML, HTML, CSV (Text) and native Chart format. Builds and exports to Flash via Flex compiler. Stream export/import capability for BLOB storage and direct output to client (eg. browser).
HTML5/Javascript, ASP.NET & ASP.NET Core 2
TeeChart for .NET includes native support to create Javascript charts for an HTML5 Canvas. It does so by referencing, at runtime, the publicly available TeeChart HTML5 minified source at the Steema web (/files/public/teechart/html5/latest/src). You are free to enhance your clientside code using this repository.
TeeChart Javascript sourcecode, supported by Steema, is available here /product/html5, or the open source version is accessible at github.com.
Enterprise Edition includes the TeeChart JS Subscription License.
Multi-language
TeeChart forms and string constants translated to 29 languages. The translation can be used at design-time and run-time.
Fast and Memory Efficient
Direct high-speed addition of Array data to the Chart making TeeChart for .NET very quick! Very quick!
Digital Signal Processing Module
TeeChart now ships with a Direct2D rendering engine. This is ideal for the high speed data throughput required by DSP realtime applications.
Multiple Axes
Use the Chart Editor to add and setup Multiple Axes or add them at runtime. Virtually unlimited Axes may be added and independently configured.
Interactive Zooming and Scrolling
Charts can be scrolled and zoomed using the mouse or by code at runtime. Zoom and scroll features can be customized using chart properties and events.
Chart Themes
Includes 14 predefined themes enabling rapid change of many chart properties with a single mouse click.
Visual Attributes
Colour palette management, Transparency and anti-aliasing on all Chart object Pens, Brushes, Fonts and Gradients. Custom 3D Drawing Objects.
Comprehensive Support
Tech support provided via Steema online Forums. Optional Professional-level technical support gives the subscriber a priority support link into Steema.
Royalty free
You may distribute your charts royalty-free for use in compiled desktop applications.
Help and Documentation
Includes Extensive demos for Visual Studio.NET including WinForms, ASP.NET WebForms and Compact Framework, code examples, Tutorials, blog articles, TeeChart wiki, etc.
| Business | Pro | Enterprise | |
| Main features | |||
| Direct2D rendering engine | V | V | |
| Chart types | |||
| Arrow, Polar, Radar, Pyramid, Candle, Point & Figure, Kagi, Renko, Histogram, ErrorBar, ErrorPoint, Funnel, BoxPlot | V | V | |
| 3D & Other: Point3D, Surface, ColorGrid, WaterFall, Contour, Triangular Surface, Tower, Vector3D, IsoSurface, PolarGrid, Bar3D, Clock, WindRose, LinePoint, BarJoin, ImageBar, TagCloud | V | V | |
| Mapping in shapefile (shp) public standard (World, Africa, Asia, Australia, CentralAmerica, Europe, Europe15, Europe27, Spain, MiddleEast, NorthAmerica, SouthAmerica, USA, USAHawaiiAlaska) | V | V | |
| Financial and Statistical indicators | |||
| Financial, Statistical, Extended Functions. | V | V | |
| Interaction | |||
| Extended Chart Tools: Includes Extra 14 Series Tools, 4 Axis Tools and 10 Other Tools. |
V | V | |
| Chart presentation | |||
| OpenGL Rendering | V | V | |
| Platforms | |||
| Windows Phone v7 & v8 support | V | V | |
| TeeChart for Xamarin.iOS product | V | ||
| TeeChart for Xamarin.Android product | V | ||
| TeeChart for Xamarin.Forms product | V | ||
| TeeChart for MAUI product | V | ||
| JavaScript sourcecode | V |
TeeGrid Grid Component for Delphi VCL and FMX
Steema 2017 年推出新產品 TeeGrid 組件「TeeGrid Grid Component for Delphi VCL and FMX」,Delphi VCL 和 FMX 的 TeeGrid 組件為您的 RAD Studio 專案提供非常快的 grid,支持跨平台開發
TeeGrid VCL / FMX Components ( for Delphi , C++ Builder, FireMonkey )
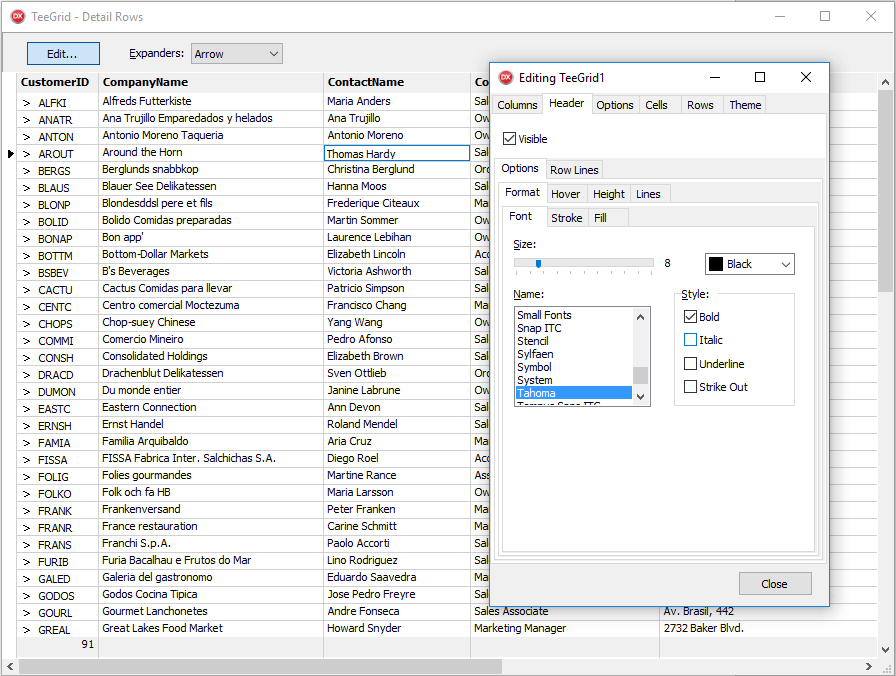
特色 (點選圖可放大觀看)
Lightweight and fully-featured grid control
Grid component written from scratch in 2016 (not derived from TCustomGrid or TGrid) to take advantage of all that's fast in Delphi!
Cross-platform
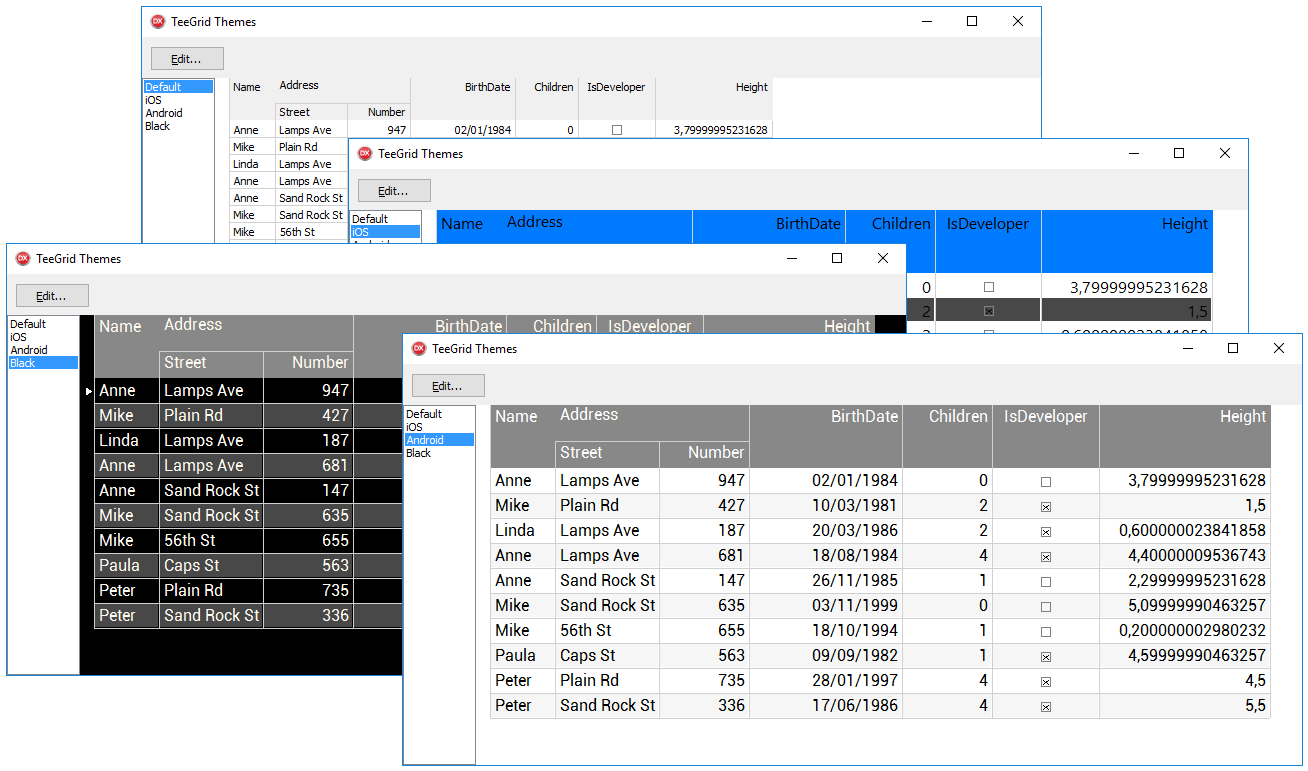
TeeGrid is fully compatible with VCL and FMX offering you the means to take common core code for gridding on Windows, Android and iOS/MacOS. TeeGrid ships with some default themes to optionally custom match to each environment.
Ticker
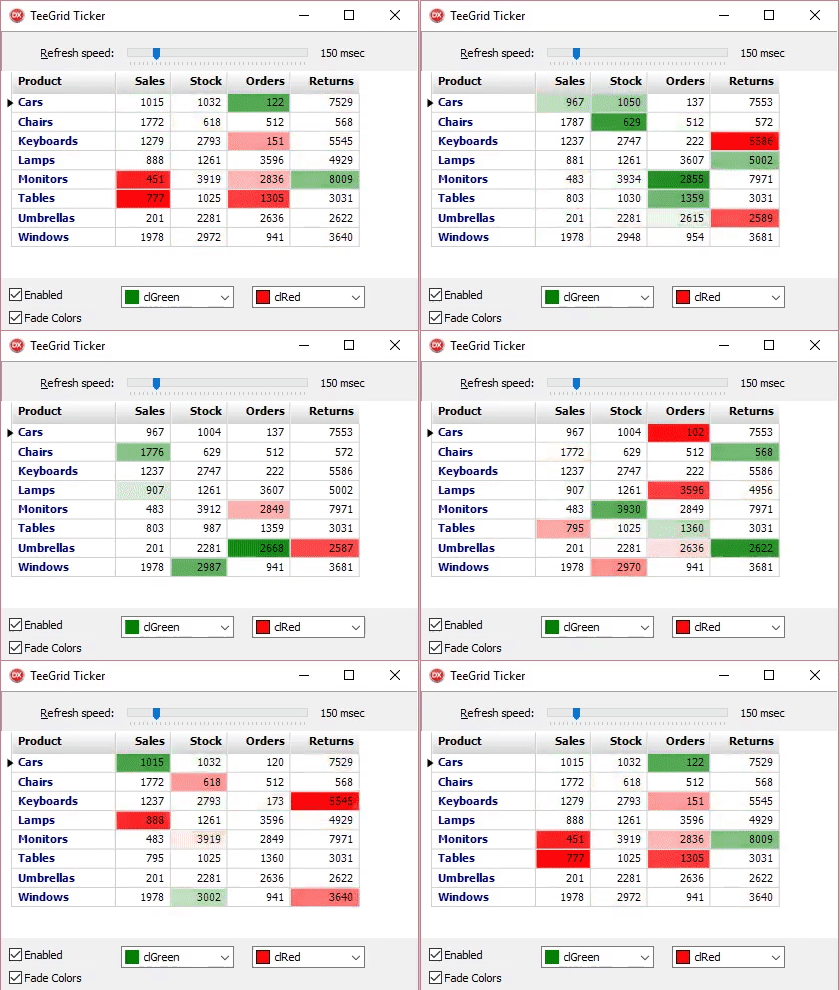
The TeeGrid "Ticker" component to automatically refresh grid cells when values are updated. VCL, Firemonkey and Lazarus. Delphi and C++, 2009 to Berlin.
Options include FadeColors, Delay, Higher.Color, Lower.Color and RefreshSpeed.
TeeSuite VCL / FMX
This suite includes a professional charting component and an easy-to-use data grid for RAD Studio developers.
Take Full Control
Full 100% source code for the entire components suite is available to you
What you Get
Fully featured Chart and Grid Controls
Priced Right For You
Bundle and save with this suite of products: TeeChart and TeeGrid
Steema’s commitment
Steema has been publishing Delphi code for you, our customers, since 1995; your satisfaction is of paramount importance to us
TeeSuite for .NET
This suite includes a charting component and easy-to-use data grid for Visual Studio .NET developers.
Easy to use
You'll see how easy it is to code and use the suite and how you can improve department development productivity.
What you Get
Fully featured Chart and Grid Controls
Priced Right For You
Bundle and save with this suite of products: TeeChart and TeeGrid
Steema’s commitment
Steema has been publishing code for more than 25 years; your satisfaction is of paramount importance to us.


