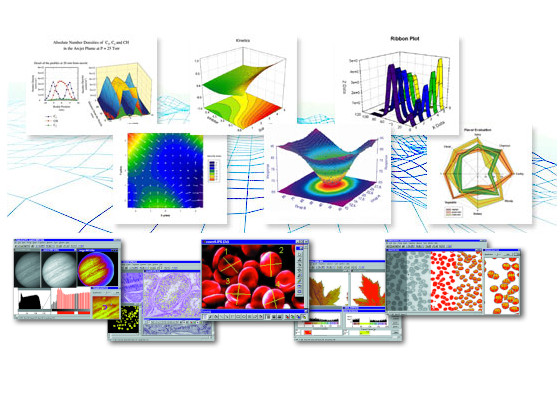
SigmaPlot 製圖軟體 超越簡單的電子表格程式,幫助你明確和準確的炫耀你的工作。通過SigmaPlot 可以產生高品質的圖形,而不需要在電腦前花大量時間。SigmaPlot 無縫集成到Microsoft Office,所以你可以很容易地訪問來自Microsoft Excel 電子表格中的數據,並在Microsoft PowerPoint 演示中呈現你的結果。

數據可視化
SigmaPlot 可以利用收藏功能以及圖表、工作表和報告的標籤選項進行繪圖,其中右擊鼠標可以查看圖表參數。交互式圖表嚮導會引導用戶創建完美圖表,用戶可以迅速得到引人注目的高質量圖表。使用內置模板或WYSIWYG 頁面佈局、變焦功能可以準確排列同一個頁面上的多個圖表。
創建精確圖表
SigmaPlot 軟體能夠快速創建精確圖表,可以幫助用戶以簡單表格的形式更清楚地展現工作結果。Graph Properties 界麵包括Office 風格功能區,通過簡單地選擇操作就可以有效組織工作表和圖表,選項窗口以水平或垂直樣式展現在選項組中,Graph Gallery 和Notebook Manger 窗口可以被移動到任何位置。
自帶100 種2D/3D 圖例模板
從簡單的2D散點圖到引人注目的輪廓圖、新雷達圖,SigmaPlot為用戶提供研究所需的多種技術圖表類型。SigmaPlot可以使多個相交的3D網格線消失,使得3D數據更加清晰可見。雙擊任一圖表元素打開圖表屬性對話框,修改圖形、表格甚至粘貼方程、符號、地圖、圖片、例證或其他圖像,增強圖表的表現力。SigmaPlot豐富的圖表類型方便用戶找到最佳方案。
隨時隨地發布圖表和圖形
SigmaPlot 可以創建幻燈片、展示報告圖表或者自定義繪圖樣式,支持保存科技雜誌或論文中的圖表並提供多種圖形輸出選項,直接展示或出版用戶的研究結果。利用SigmaPlot 報告編輯器或者圖表中內嵌的第三方應用程序,如文字處理器、微軟PPT 等,可以創建自定義報告。
在線分享高質量圖表數據
SigmaPlot 可以導出高分辨率圖表和動態網頁,並非簡單的GI F或JPEG 文件,瀏覽者通過創建矢量圖直接從瀏覽器中縮放、移動、影印圖片來研究數據,用戶圖表或內嵌網頁自動生成有效網頁對象。支持在現有的HTML 文件中內嵌SigmaPlot 網頁對象來創建交互式的電子報告。
超簡單的數據分析
SigmaPlot 提供多種基本工具,可滿足從基本統計到高級數據計算的多種需求。單擊“查看列統計”按鈕可以即刻生成匯總數據,數據可靠性在95%-99% 之間。軟體支持線性回歸分析、非線性回歸分析和方差分析等多種數據分析方式。
回歸嚮導準確擬合數據
SigmaPlot 回歸嚮導擬合數據的功能十分出色,回歸嚮導自動確定用戶初始參數,編寫統計報告並保存方程到SigmaPlot 筆記本。回歸嚮導準確地擬合所有函數方程,包括多函數、加權函數、布爾函數,甚至是包含多個變量和參數的函數,用戶可以添加曲線擬合方程並將其添加到回歸嚮導。
兼容多種類型數據
SigmaPlot 可以導入所有常見格式文件,包括通用的ASCII 文件和所有Excel 文件。此外SigmaPlot 還支持SPSS、Minitab、SYSTAT和SAS 數據輸入格式。
SigmaPlot 支持輸入軸突二進制和文本電生理學文件,同時支持輸入任何ODBC 兼容數據庫、Excel 和Access 數據庫文件,能夠運行SQL查詢表並選擇性導入信息。
自動化管理
SigmaPlot 軟體通過宏操作自動化管理數據,單擊SigmaPlot“ 宏記錄器”即可記錄宏,使用SigmaPlot 提供的三十個內置宏的其中之一均可以快速創建自己的宏。用戶可以使用宏來獲取數據、執行強大的分析方法或建立行業特定的圖表。
自動化管理
SigmaPlot 軟體通過宏操作自動化管理數據,單擊SigmaPlot“ 宏記錄器”即可記錄宏,使用SigmaPlot 提供的三十個內置宏的其中之一均可以快速創建自己的宏。用戶可以使用宏來獲取數據、執行強大的分析方法或建立行業特定的圖表。
SigmaPlot supports various environments
Hardware
- 2 GHz 32-bit (x86) or 64-bit (x64) Processor
- 2 GB of System Memory for 32-bit (x86)
- 4 GB of System Memory for 64-bit (x64)
- 300 MB of Available Hard Disk Space
- CD-ROM Drive or Internet Connection
- 800×600 SVGA/256 Color Display or better
- Internet Explorer Version 8 or better
Software
- Windows XP, Windows Vista, Windows 7, Windows 8.x, Windows 10; Internet Explorer 6 or higher
- Office 2003 or higher (paste to Powerpoint Slide, Insert Graphs into Word and other macros)
 SigmaStat
SigmaStat is an easy-to-use, wizard-based statistical software package designed to guide users through every step of the analysis and perform powerful statistical analysis without being a statistical expert. SigmaStat is tailored to the areas of life science and medical research, but can be a valuable product to scientists in many fields.
With SigmaStat, you can be confident that you have analyzed your data correctly.
And you save time, too!
Because it takes you step by step through the analysis, SigmaStat ensures that you:
• Use the proper statistical method to analyze your data
• Avoid the risk of statistical error
• Interpret the results correctly
• Generate an appropriate display and a professional report
 SYSTAT
Powerful Statistical Analysis and Graphics Software
SYSTAT 13 is quicker, sturdier and more robust than any of its predecessors
Simplify your research and enhance your publications with SYSTAT’s comprehensive suite of statistical functions and brilliant 2D and 3D charts and graphs.
Systat Software proudly introduces SYSTAT 13, the latest advancement in desktop statistical computing. Novice statistical users can use SYSTAT’s menu-driven interface to conduct simple analyses and produce beautiful 2D and 3D graphics for presentations or reports.
Those in need of advanced analysis can use SYSTAT’s more sophisticated statistical routines, and create plots and charts that are instantly ready for publication. SYSTAT’s menu and command interfaces are interlinked, allowing users the option of whichever method works best for them.
 TableCurve 2D
Automated curve fitting and equation discovery
TableCurve 2D® gives engineers and researchers the power to find the ideal model for even the most complex data, by putting thousands of equations at their fingertips.
TableCurve 2D’s built-in library includes a wide array of linear and nonlinear models for any application including equations that may never have been considered, from simple linear equations to high order Chebyshev polynomials.
 TableCurve 3D
Model Complex Data Sets Fast and Easy
TableCurve 3D is the first and only program that combines a powerful surface fitter with the ability to find the ideal equation to describe three dimensional empirical data.
TableCurve 3D uses a selective subset procedure to fit 36,000 of its 453,697,387 built-in equations from all disciplines to find the one that provides the ideal fit – instantly!
 PeakFit
Automatically Places Peaks in Three Ways.
PeakFit uses three procedures to automatically place hidden peaks; while each is a strong solution, one method may work better with some data sets than others.
The Residuals procedure initially places peaks by finding local maxima in a smoothed data stream. Hidden peaks are then optionally added where peaks in the residuals occur.
The Second Derivative procedure searches for local minima within a smoothed second derivative data stream. These local minima often reveal hidden peaks.
The Deconvolution procedure uses a Gaussian response function with a Fourier deconvolution / filtering algorithm. A successfully deconvolved spectrum will consist of “sharpened” peaks of equivalent area. The goal is to enhance the hidden peaks so that each represents a local maximum.

