產品目錄
產品目錄
FMEA Studio 靈活的 FMEA 軟體
在 Excel 中更快、更簡單
繼續您的 FMEA 風格,但使用 FMEA Studio 在 Excel 中更快、更輕鬆
節省您的寶貴時間
比以往更快、更輕鬆地無縫建立和編輯 FMEA、流程圖和控制計劃。
簡化 FMEA 的複雜性
FMEA 方法可能很複雜,但使用 FMEA Studio,您可以輕鬆防止錯誤並確保準確性。
使用者友好且協作
FMEA Studio 與 Excel 無縫集成,提供使用者友好的介面,可輕鬆建立、編輯和共用文件。
需要更簡單、更快速的FMEA 軟體嗎?
讓我們嘗試一下 FMEA Studio,看看為什麼它可以讓您的 FMEA 變得更簡單和靈活
力量與靈活性的平衡
FMEA Studio 具有全面的功能,可滿足您的所有 FMEA 要求。
符合 FMEA 標準
無論您遵循 IEC 60812、AIAG FMEA 手冊或新的 AIAG/VDA FMEA 手冊,FMEA Studio 都能確保符合您所依賴的指南。
可定制以滿足您的獨特需求
使用 FMEA Studio,您可以自訂模板結構、外觀和風險評估方法來滿足您的特定要求。
GeneXproTools 是一款靈活的預測建模工具,其設計有功能查找、logistic回歸、分類、時間序列預測和邏輯合成等功能。GeneXproTools非常方便使用,只要您輸入數據資料、點擊滑鼠,使用GeneXproTools系列模板為你設計模式,將能夠立即生成一個模型。本軟體有四個版本GeneXproTool-Standard、Advanced、Professional及Enterprise。
GeneXproTools可處理數以萬計的變數的資料集,並且可以毫不費力地找出顯著點及其相互關係。GeneXproTools也是非常平易近人的應用程式,其簡化所有類型資料的存入,包含原始的文字檔資料庫和Excel試算表。您不知道需要精通任何程式設計語言以建立精確和複雜的模型。 GeneXproTools提供所有必要功能包含:負荷訓練和測試、生成模型、執行結果的統計分析,並應用該模型產出新的分析資料。此外,GeneXproTools可以幫您轉換成多達16種主流程式語言,如:Ada、C、C++、C#、Fortran、Java、Java Script、Matlab、Pascal、Perl、PHP、Python、Visual Basic、VB.Net、Verilog及VHDL等等。
高品質模型
GeneXproTools產出的模型非常準確且強大,可以同時觀察和測試十二個樣本或使用自己的數據進行運算。在試算模式下,GeneXproTools可讓您載入數據、建立模型,並審查這些模型的統計分析。樣本分析沒有設定任何限制,因此可以探索和學習完整的流程,從模型結構和編碼,到模型評估和模型簡化。
無限的變量和樣本
GeneXproTools可以處理任何樣本和變量,除非受到電腦硬體資源的限制。使用新型的電腦可以不費吹灰之力處理一到兩億以上的儲存格。新的文件格式,可以非常有效率的在幾秒鐘內載入數據並且存儲。
方便使用
GeneXproTools是迄今為止市場上最方便的預測建模軟體,簡單的嚮導和概念,僅需了解計算機基礎知識,即可分析複雜的資料。可以幫助世界各地的使用者作出突破性的發現和創造非凡的新產品,因為GeneXproTools為任何研究領域提供理想的建模平台。GeneXproTools不僅可以應用再簡單數據分析中,還包含了建模平台的所有優點。正如知識的工具的進展,你會發現GeneXproTools將會增加你的工作成效,並進一步改善的工作結果。
GenStat 是個數據分析工具,也是統計軟體。事實上,GenStat 可以被稱為「我工作中不可或缺的幫手」。GenStat 是一款功能強大的統計系統軟體。靈活而完全交互式系統,最先進的圖形化工具,友好的圖形化用戶界面,以及強大的統計學程式編製功能。GenStat幫助你處理工程上的數據統計,科學研究中的數據分析...等。GenStat 具有悠久的成功歷史,並且不斷更新發展,使其活躍在統計學技術的最前沿。被廣泛應用於學術界、科研探索以及工業領域。
GenStat 是透過一個視窗選單介面讓初學用戶便於使用的全面化統計系統, 也可透過一個強有力的命令語言介面讓有經驗的用戶有更多的權力和靈活性。
完全互動式系統,最先進的圖形化工具,友好的圖形化用戶介面,還有強大的統計學程式編制功能。GenStat 具有30年悠久的成功歷史,並且不斷更新發展,使其活躍在統計學技術的最前端。GenStat的主要優點之一是已經透過培養訓練統計員重複被測試的可提供的統計方法的巨大的範圍,穿過很多應用和訓練。
basic statistics 基本的統計
design and analysis of designed experiments 實驗設計
analysis of linear and generalized linear mixed models
microarray analysis
regression (linear, nonlinear and generalized linear)
hierarchical generalized linear models
spatial analysis 空間分析
multivariate analysis techniques 多變量的分析技術
time series 時間序列
statistical process control methods 統計過程式控制制方法
survival analysis 生存分析
sample size calculations and resampling methods
更新介紹
23 new procedures
4 new functions
Analysis of variance for censored data (ATOBIT, AUTOBIT)
Analysis of censored regression analyses with Normal, gamma and negative binomial data (RGTOBIT, RNTOBITRNBTOBIT)
REML analysis of field trials using a two-dimensional spline model (V2DSPLINE)
Design and analysis of sets of n-of-1 trials (N1ANOVA, N1DESIGN, N1PLOT, N1SIMULATE, N1TTEST)
Negative binomial probabilities and random numbers (CLNEGATIVEBINOMIAL, CUNEGATIVEBINOMIAL, EDNEGATIVEBINOMIAL, PRNEGATIVEBINOMIAL, ELNEGBINOMIAL, EUNEGBINOMIAL, GRANDOM)
Gamma distribution expected values (ELGAMMA, EUGAMMA)
Improved default settings for the symbols, colours and line-styles used in graphs
At the start of each job, the server now loads the default graphics environment that is specified in the computer’s Registry, and that Registry setting can be accessed and defined (GET, SET)
Heatmaps (DBANDCOLOURS, DHEATMAP, FHEATCOLOURS)
Graphical displays of data in a table, so that you can create PDF reports that include graphs (DPRINT)
友環為 IBM 軟體代理商夥伴
IBM® SPSS® Statistics 為分析資料的強大系統。SPSS Statistics可以從幾乎所有的檔案類型中擷取資料,然後利用這些資料來產生表格化報告、圖表,以及分配與趨勢的統計圖、敘述統計和複雜的統計分析。
Statistics Base 提供多項基本分析與報告的統計程序,包括個數、交叉表與敘述統計、OLAP 多維度報表,以及編碼簿報告。其也提供多項維度縮減、分類與分段技術,例如因子分析、集群分析、最近鄰法分析,以及判別函數分析。此外,SPSS Statistics Base 也提供許多種演算法,以用於比較平均數與預測技術,例如 t 檢定、變異數分析、線性迴歸以及次序迴歸。
進階統計量重點放在臨床實驗與生物醫學研究中常用的技術。其中包括用於一般線性模式 (GLM)、一般混合模式、變異成份分析、對數線性分析、次序迴歸、保險統計生命表、Kaplan-Meier 存活分析、以及基本與延伸式 Cox 迴歸的程序。
自助法方法可獲得可靠的標準誤估計值和如下列各種估計值的信賴區間:平均數、中位數、比例、odds 比率、相關係數或迴歸係數。
類別執行最適尺度程序,包括對應的分析。
複合樣本可讓調查、市場、健康和公眾輿論的研究人員,以及使用樣本調查方法的社會科學家,將複合樣本設計納入資料分析中。
Conjoint 提供實際可用的方式,測量各個產品屬性如何影響消費者和一般國民的偏好。有了 Conjoint,可以簡易地在一組產品屬性的條件下,測量各產品屬性的平衡取捨—,就像消費者在決定是否購買時經常作的考量。
自訂表格可建立各種簡報品質的表格式報表,包括複雜的行列表格以及複選題資料的顯示 。
準備資料提供資料的快速視覺快照。提供功能套用驗證規則,挑出無效的資料值。您可以建立會標示超出範圍之數值、遺漏值,或空白數值的規則。您也可以儲存會紀錄個別違規,和每一個觀察值之違規總數的變數。也提供一組預先定義的規則,讓您進行複製或修改。
決策樹狀結構可建立樹狀結構式分類模式。它會根據自 (預測值) 變數的值,將觀察值分成組別,或依變數 (目標) 的預測值。這個程序會提供用於解釋與確認分類分析的驗證工具。
直效行銷運用專為直效行銷設計的技術,可讓組織確保其行銷方案能發揮最大效益。
精確檢定可在小量或分配極不平均的取樣所造成之一般檢定不精確時,用來計算統計檢定的精確 p 值。本選項只能在 Windows 作業系統上使用。
預測使用多重曲線填入模式、平滑模式、以及估計自動迴歸函數的方法來執行廣泛的預測與時間數列分析。
遺漏值描述遺漏值的形式、估計平均數及其他統計量,以及插補遺漏觀察值的數值。
您可以使用 神經網路,以產品需求預估作為價格和其它變數的函數,或是根據購買習慣和人口統計所作的客戶分類,來做出商業決策。神經網路是非線性資料建模工具。它們可用來將輸入和輸出間複雜的關係建成模式,或找出資料中的樣式。
迴歸提供不適用於傳統線性統計模式的資料分析技術。其中包括用於 probit 分析、logistic 迴歸、權重估計、二階最小平方迴歸、以及一般非線性迴歸的程序。
Amos (動差結構分析) 使用結構式方程式模型,以確認並解釋推動行為背後包含的態度、感覺及其他因子的觀念模式
Latent GOLD is a powerful latent class and finite mixture program with a very user-friendly point-and-click interface (GUI). Two add-on options are available to extend the basic version of the program.
The Advanced/Syntax add-on enables more control for advanced users via use of a Syntax command language including intuitive LG-equations™. This add-on also contains more advanced GUI modeling features such as Latent (Hidden) Markov and Multilevel models.
The Choice add-on allows estimation of discrete choice models via the point-and-click interface. When obtaining both the Choice and the Advanced/Syntax add-on, various advanced choice models can be estimated and the Syntax can also be used to further the customize discrete choice models.
LatentGold最主要的功能為:
潛類聚類分析(latentclass clusteranalysis)
潛類因子分析(latentclassfactor analysis)
潛類回歸模型(latent classregression)
Basic version Includes GUI for
LC Cluster
Latent GOLD®'s cluster module provides the state-of-the-art in cluster analysis based on latent class models. Latent classes are unobservable (latent) subgroups or segments. Cases within the same latent class are homogeneous on certain criteria (variables), while cases in different latent classes are dissimilar from each other in certain important ways.
The traditional latent class model can be used to handle measurement and classification errors in categorical variables, and can accomodate avriables that are nominal, ordinal, continuous, counts, or any combination of these. Covariates can be included directly in the model as well for improved cluster description.
Latent GOLD® improves over traditional ad-hoc types of cluster analysis methods by including model selection criteria and probability-based classification. Posterior membership probabilities are estimated directly from the model parameters and used to assign cases to the classes.
Discrete Factor (DFactor)
A DFactor model is often used for variable reduction or to define an ordinal attitudinal scale. It contains one or more DFactors which group together variables sharing a common source of variation. Each DFactor is either dichotomous (the default option) or consists of 3 or more ordered levels (ordered latent classes).
In this way, Latent GOLD®’s factor module has several advantages over traditional factor analysis:
Solutions are immediately interpretable and don’t require rotation
The factors are assumed to be ordinal and not continuous
No additional assumptions are required to estimate factor scores
The observed variables can be nominal, ordinal, continuous, or counts, or any combination of these
LC Regression and Growth
A Regression model is used to predict a dependent variable as a function of predictor variables in a homogeneous population.
Latent GOLD® makes it possible to estimate a regression model in a heterogeneous popu...
MedCalc 是專位醫學工作者設計的完整統計程式(可應用在Windows,新版支持Windows 11),它是快速、便於操作和可靠的軟體。
MedCalc 是一個用於生物醫學研究的統計軟體包。統計包括 220 多個統計測試、程序和圖表。ROC曲線分析、方法比較和品質控制工具。
NCSS 是一款小巧而優秀的統計分析軟體,與SPSS、SAS、S-Plus同屬一類的統計軟體。其介面友好,功能齊全,可以進行描述性統計、相關及回歸分析、試驗設計、品質控制、生存及可靠性分析、多元分析、時間序列分析及預測、統計圖表繪製等操作。
從1981年以來,NCSS就擅長向一些特殊統計場合的用戶提供統計分析軟體。NCSS可以運行於Windows的32-bit和64-bit系統,具有全面功能的,易於使用的特點。
功能全面準確,價格便宜;
包含190多個統計方法和統計圖;
易學易用;
導入導出所有主流的試算表、資料庫和統計檔格式;
清晰靈活的圖形;
輸出的結果可輕鬆轉發到文字處理器
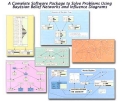
Netica 是一款功能強大且易於使用的完整解決方案,他可運用在信度網路(belief networks)以及影響圖(Influence diagrams)。直觀的用戶介面供使用者繪製網絡,用圖形來顯示網路結構,或是利用機率來描述變數間的強弱關係。
一旦建立網絡系統,他的領域知識可以透過複製貼上功能轉移到其他網路系統,視需要對所學出來的貝氏網路結構做修改。或是以創建連結中斷的節點庫儲存整模形式。當然,網絡結構和資料庫可以保存在檔案夾中或是列印出來。
Netica可以用網路系統進行各種最快速的推測模型、最現代的演算法。即使給的案例資料有限,Netica還是能在未知的變量中,找到適當的數值推測出我們需要的模型。這些數值或機率可能會以不同的形式像是柱狀圖或示意圖顯示。該範例可以方便的保存在檔案夾中,再從相同的網絡結構(或是不同的網絡結構)進一步查詢。使用者可以利用影響圖(Influence diagrams)在最大化的指定變量的期望值找出最佳的決策。
Netica可以建構條件規劃,因為使用者可以依靠可靠的意見做出決定,而時間與相互之間關聯的也會被列入考慮的重點。
Netica可以處理當學習資料增加時動態改變前端機率及條件機率表的問題。也可透過這個工具所提供的程式庫,使用Visual Basic 及C/C++等程式語言來控制及操作貝氏網路。
系統需求
Requirements: Netica Application requires a PC running any version of Microsoft Windows from XP to Windows10. The 64 bit version of Netica requires Windows 7 or higher. If you need a version of Netica for an earlier version of Windows (such as Windows 95), use Netica32.exe from the download package, or contact Norsys. Installation requires less than 10 MB of hard disk space.
Netica will run well even on a very slow PC (0.4 GHz), using very little RAM (about 30 MB), but working with complex Bayes nets may require much more speed and large amounts of RAM.
NLREG -- Nonlinear Regression and Curve Fitting
NLREG是一款強大地統計分析軟體。能夠進行線性和非線性回歸分析、表面和曲線擬和。此款軟體可以為一個方程式決定其參數值。NLREG能夠處理線性、多項式、指數、對數、周期性與一般的非線性函數。
NLREG features a full programming language with a syntax similar to C for specifying the function that is to be fitted to the data. This allows you to compute intermediate work variables, use conditionals, and even iterate in loops. With NLREG it is easy to construct piecewise functions that change form over different domains. Since the NLREG language includes arrays, you can even use tabular look-up methods to define the function.
The Standard version of NLREG can fit up to 5 variables and parameters to the data observations. The Advanced version can handle up to 2000 variables and parameters. In addition, the Advanced version can generate 3D surface plots such as shown here:
In addition to performing classic nonlinear regression, NLREG can be used to find the root or minimum value of a general multivariate, nonlinear function. It can also be used in a special form where the independent variable is omitted; an interesting application of this is "circular regression" where a circle is fitted to a set of data points.
Noiseatwork 是一個非常容易使用的工具,可以將任何類型的量測報告為等高線插繪法。工業和職業衛生學家使用它來幫助他們報告工作時的譟音和室內外工作場所的其他類型的量測。關鍵字適合使用,易於使用,成本效益高。NoiseToWork有2個可選附加組件。基於LEX或TWA的雜訊劑量計算和根據VDI2720進行遮罩計算的雜訊預測。
為職業健康和安全專家量身定制的軟體
對於任何測量的職業指標,例如以dB表示的噪音(A),以°C為單位的溫度,以百分比表示的濕度和/或以ppm表示的氣體濃度
快速,簡單,高效
可以在幾分鐘內學會
內插輪廓圖只需點擊幾下,無需CAD
噪聲放射量和噪聲預測的可選附件
Statsols 20多年來一直通過統計軟體引領市場。nQuery 是世界上最值得信賴的樣本量和功耗分析軟體之一。
nQuery提供簡單有效的方法來計算並找出可靠區間及等效分析,以決定樣本的大小及統計的幕數。。生物統計學家最常使用它來確定參加臨床試驗需要多少人。
nQuery包括近1000個樣本大小和功率方案的計算。且擁有大量易於使用但功能強大的功能,可用於樣本量計算和功效分析。
Power and Precision 是一組獨立的強大統計分析軟體,可以在計畫研究中的案例分析做計算。這個程式的特色包含一個乾淨清楚的界面,還有許多幫助用戶發展理解能力分析的工具。它結合了建立表格、圖表和結果報告的能力,並在單鍵點擊下完成。
Work Interactively!
交互式的導覽讓你在 power analysis 中瞭解所有的步驟
在研究中修改任何元素並且能立即的看到相對的影響結果
利用大量的工具使影響使其可見化,並且了解 alpha, effect size, and sample size 的影響作用
Create A Report with a Single Click!
此程式產生一個清晰易懂、讓人充分理解的報告來解釋這個研究的設計、假設和權限
這個報告提供像教學工具一樣的服務,也可在讀書計畫和獎學金申請中的統計部分使用
可以輸出至 WordTM 或是其他 word 處理程式
Create Tables and Graphs with a Single Click!
在短時間內了解大綱!利用圖表來快速評估研究設計中的任何選項
可輸出至Word™, Excel™, PowerPoint™和其他程式
Include the graphs in your presentation or grant application to justify your selection of a sample size.


.jpg)


.gif)
.jpg)
